Economía
EUR/USD FORECAST
4 July 2023
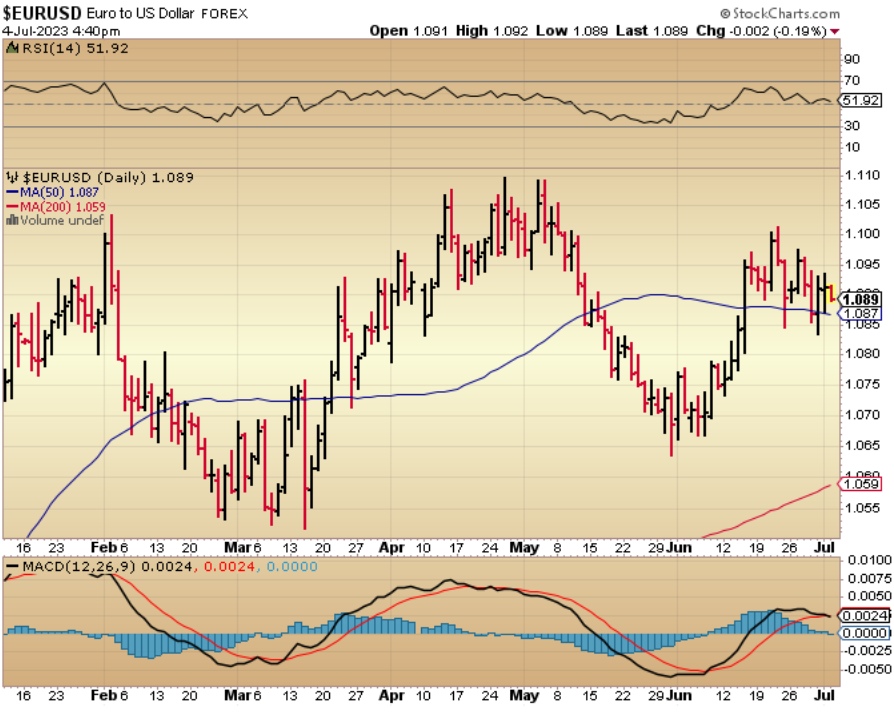
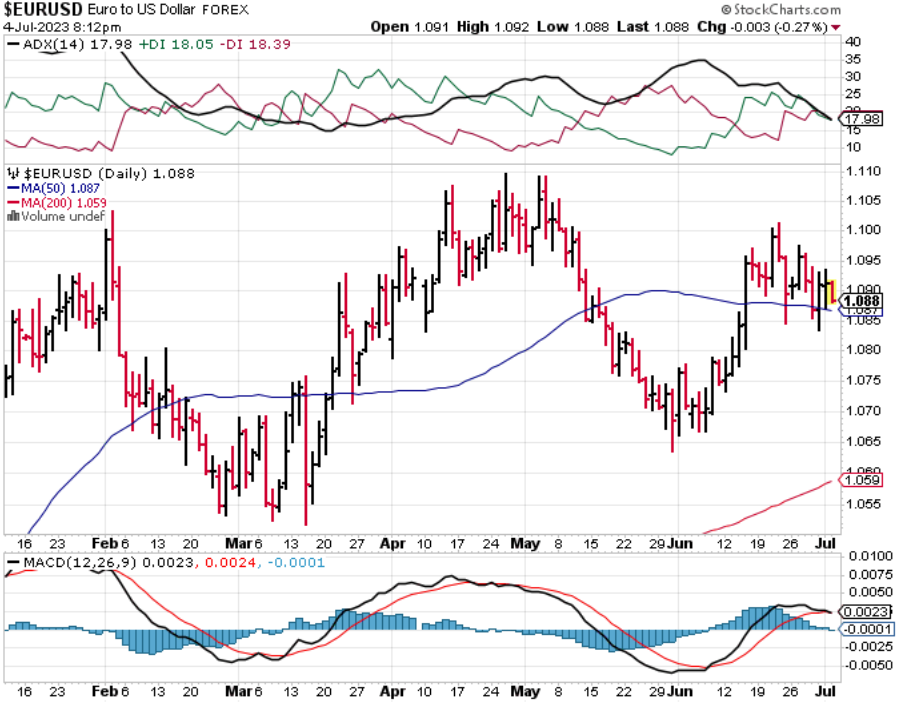
EUR/USD DAILY FORECAST: The impulsive move from the May 31 low of $1.0686 has cooled off and is currently in a consolidation phase. The price range has retraced enough to push the ADX to 17.98, while the +Di has dropped to 18.05, just below the -Di at 18.39. Today, the pair opened at $1.0913 and has been declining throughout the day, currently trading at 1.088. However, this drop is still part of the overall correction from the June 22 high of $1.1092. The MACD has also slowed down, with the Signal line slightly below the MACD line by 0.0001. I anticipate this correction to conclude soon. The price is currently 0.91% above the 50-day Simple Moving Average (SMA), holding above it, and it is 2.73% above the 200-day SMA, indicating that the bullish trend is still intact.
The EUR/USD monthly bar below shows a significant Cycle Degree bearish trend originating from the $1.6038 July 2008 all-time high. So far this 15-year trend has taken the form of a double zigzag.
Double zigzags are corrective structures that consist of two zigzags labeled W and Y which are separated by a counter corrective three wave structure labeled X.
Here, Cycle-W completed its zigzag at the $1.0462 March 2015 low. This zigzag consist of Primary Degree waves A-B-C (5-3-5 wave structure). Primary Circled-A completed its first five wave impulse in a heartbreaking 4 months at the $1.2329 Sep 2008 low. However, price then took over 5 years carving out an intermediate triangle completing Primary Circled-B at the 1.3993 May 2014 high. The counter corrective B wave retraced past the Fibonacci 38.2% BvsA falling short of the 50%. The ensuing bearish impulse took 10 months to hit a low of $1.0462 in March of 2015 capping off Cycle W. Notice that the CvsA price-time symmetry was near perfect. Price fell short of the 423.6% CvsA time and the 100% CvsB price near lower Primary Degree channel support.

As mentioned X waves are always three wave ranges. And the move from Cycle Degree W low has been ranging almost 8 years now.
Now, the question arises: What kind of corrective structure is currently forming? Furthermore, how can I determine whether this downward trend at the Cycle Degree level has come to an end? Additionally, is the rally from the 2022 low indicative of a new trend leading to all-time highs?

One could argue that the rally to the high of 1.2555 in February 2018 marked the termination of Cycle X, while the preceding three-wave drop to the low of $0.9535 in August 2022 signaled the end of Cycle Y. This particular scenario would conclude the Cycle Degree Double Zigzag and potentially initiate a rally that could propel EUR/USD to reach new all-time highs.
However, I find this scenario unlikely. Firstly, the rally to the 2018 high would be too small. X waves are typically larger than the preceding counter corrective waves of a lesser degree. In the case of EUR/USD, we can observe that Primary Circled B took just under 5 years to complete. In contrast. the range from the 2015 low has been ongoing for almost 8 years.
Also, the drop to the 2022 low wave retraced just past the 138.2% of the move up to the 2018 high. Once price rallied back up above the 2015 low, it opened up the possibility that the contraction from the 2015 low is still forming.
Besides, given the expanding flat capped at the 2018 high and the subsequent 138.2% retracement of it, we can be confident that an expanding flat is now forming for Cycle X. Remember that flats usually have flats as their A waves. And here, EUR/USD has one at Intermediate Degree for Primary Circled-A at the 2018 high.
So far Primary Waves A-B of Cycle-X completed at the $1.2555 Feb 2018 high and the $0.9535 Sep 2022 low respectively. Now Cycle Degree Circled-C is underway with its Intermediate Degree (1) and (2) most likely done. There is a chance this flat can turn out to be a running instead of an expanding version. But running flats are rare and if they do form usually always fail at the flats channel upper trend line. What is most likely forming here is an expanding variety and they always retrace better than 100% CvsA but short of the 138.2% CvsA.
Upside resistance for EUR/USD is the upper channel trend line and the Fibonacci 100%, 114.6%, 123.6% and 138.2% CvsA. Past this Fibonacci zone and chances increase we are going to all-time highs. But I doubt it for reason given above.
EUR/USD daily chart forecast at Intermediate degree. Chances are good that Intermediate Degree (1) finalized at the $1.1033 Feb 1 high. The subsequent consolidation is also most likely compete at the $1.0635 May 30 low for a running flat completion. The ensuing rally has also cut out an impulse at the near $1.1012 June 21 high. Upside resistance is at the $1.1095 and the Fibonacci retracements of Minor Degree C from the 100.0% to the 138.2%. These are the resistance targets in case a leading diagonal is forming instead of the Intermediate degree impulse mentioned above.
