
Economía
🪙 Bitcoin All-Time High | Technical Outlook and Elliott Wave Analysis
6 October 2025
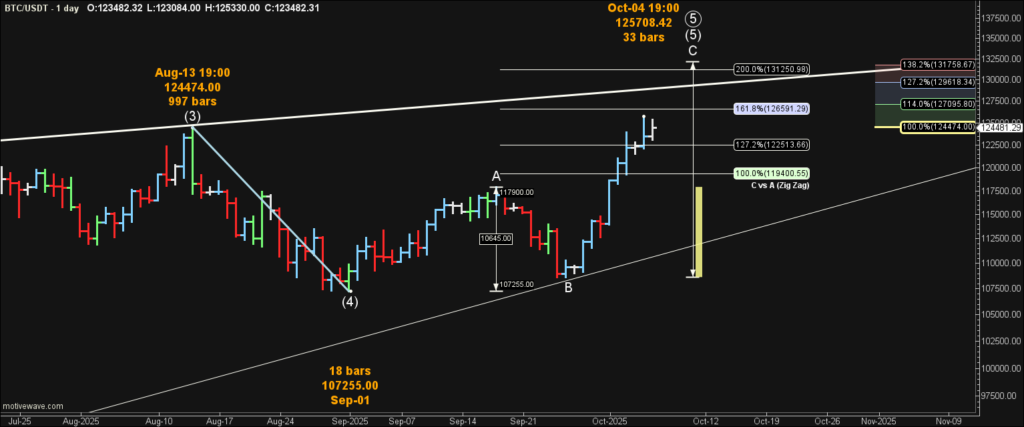
Date: Oct 6 2025 | Exchange: Binance (BTC/USDT) | ATH: $125,708.42 (Oct 4 – 19:00 New York)
Bitcoin all-time high: Despite the record, both market structure and momentum indicators are warning of a possible mid-term downturn. During the Asian session on Oct 4, Bitcoin printed a fresh all-time high at $125,708.42, breaking above the August 2025 peak near $124,474. This new high forms at the end of an Elliott Wave structure, suggesting the advance may be reaching exhaustion. Momentum and volume divergence also point to a late-stage bull move and rising risk of a reversal.
The uptrend from the September low ($107,255) remains intact, but price is now pressing into the upper Fibonacci resistance zone. This area also aligns with the upper channel trend line of the Intermediate degree structure, which is now nearly complete. The confluence between Fibonacci resistance and the diagonal boundary marks the possible termination of Primary wave (5) — a potential terminal juncture in the larger trend.
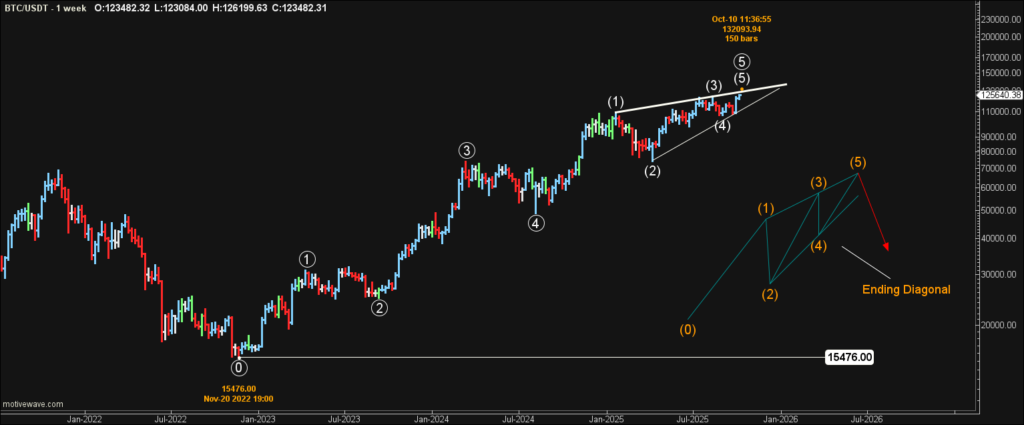
From the November 2022 low at $15 476, Bitcoin has advanced in a complete five-wave impulse at Primary degree. The final Primary (5) is a contracting ending diagonal, each leg a zigzag (3-3-3-3-3) with Wave 1 and 4 overlap.
Within it, Intermediate (5) is a zigzag (A-B-C). Wave C has already passed 100 % and now sits between 127 % and 161.8 %, pressing against the upper trendline.
Fibonacci resistance levels
| Relationship | Ratio | Price (approx) | Comment |
|---|---|---|---|
| Intermediate (5) vs (4) | 114 % | $127 095 | lower edge of zone |
| Intermediate (5) vs (4) | 127.2 % | $129 618 | major resistance |
| Intermediate (5) vs (4) | 138.2 % | $131 758 | trend-line confluence |
| Intermediate (5) vs (4) | 144 % | ~ $132 750 | outer harmonic |
| Minor C vs A | 161.8 % | $126 591 | upper C extension |
| Minor C vs A | 200 % | $131 251 | terminal projection |
| Upper Diagonal Trend Line | — | ≈ $131 500 | perfect confluence |
The weekly ADX prints ≈ 23.68, confirming a strong trend yet flattening and diverging from the momentum peaks of Intermediate (1) and (3).
That loss of directional strength is typical of a terminal move.
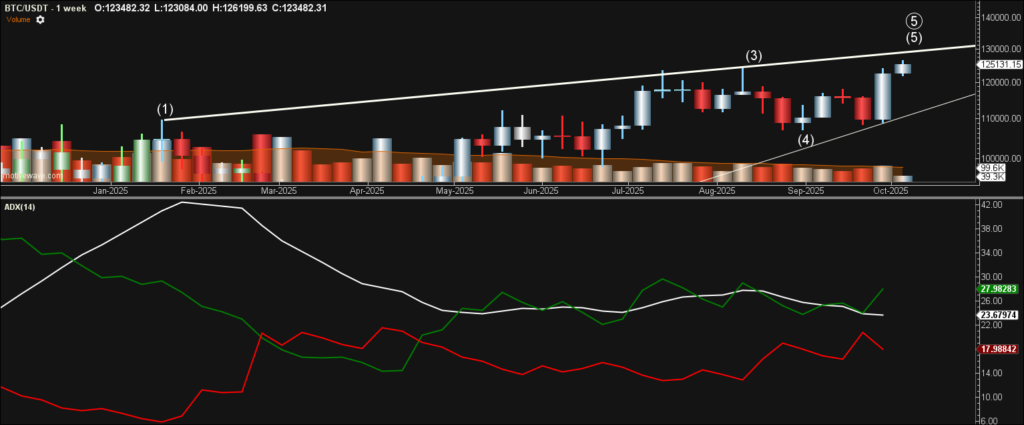

Volume tells the same story. Weekly turnover is around 99.4 K, low for a breakout week, while the daily candle that drove the high printed 97.8 K — above its 20-EMA average but still below the 120 K + seen at the Intermediate (1) peak in January. Price is rising on thinner participation, a classic late-stage signal.
The Bitcoin all-time high marks the end of a major advance. Momentum may still carry price into the $127 K – $131.8 K zone, but with ADX and volume diverging while price testing the upper wedge, a Primary-degree correction could be next.
Price may still push higher in the coming week or weeks, but the overall structure continues to favor a downturn at Primary degree — a move that could develop into a significant pullback.
The Fibonacci 138.2% extension of Intermediate (5) vs (4) serves as the key inflection point. If price turns down from this resistance zone, the Primary-degree correction remains the preferred outlook.
However, if Bitcoin moves above the 138.2% level and closes one or more daily sessions above it, the ending diagonal count becomes invalid. In that case, the alternate scenario gains weight — the current advance would most likely represent the early stages of a powerful wave (3) at Intermediate degree, implying a much larger continuation to the upside.
Until that confirmation occurs, the confluence of Fibonacci resistance and upper channel alignment keeps the risk skewed toward a terminal reversal.
In short, Bitcoin’s all-time high sits at a technical crossroads — capped by Fibonacci resistance but holding open the door to a major impulsive continuation if 138.2% is breached.
This publication is provided for educational and informational purposes only.
It does not constitute financial advice, investment recommendations, or any offer to buy or sell securities, cryptocurrencies, or related products.
The analysis represents personal technical interpretation based on publicly available market data.
EWFOREX S.A.C. and its authors do not provide portfolio management, brokerage, or investment advisory services.
Readers should perform their own due diligence or consult qualified professionals before making financial decisions.
This content complies with SBS Perú communication standards and Google’s financial content policies for educational analysis.