Economía
Bitcoin Price Update
28 October 2025
Bitcoin price: BTC/USDT – Weekly Bar Chart (Binance)
Open: 114,107.65 High: 114,483.30 Low: 113,483.30 Last: 114,486.43
Elliott Wave Overview Bitcoin price in USDT Binance:
Bitcoin price showing possible further decline. Intermediate wave (5) of Primary wave ⑤ appears to be nearing completion. The rally peaked at the $126,199 all-time high on October 6, forming a clear momentum divergence on the ADX indicator, suggesting waning upside strength.
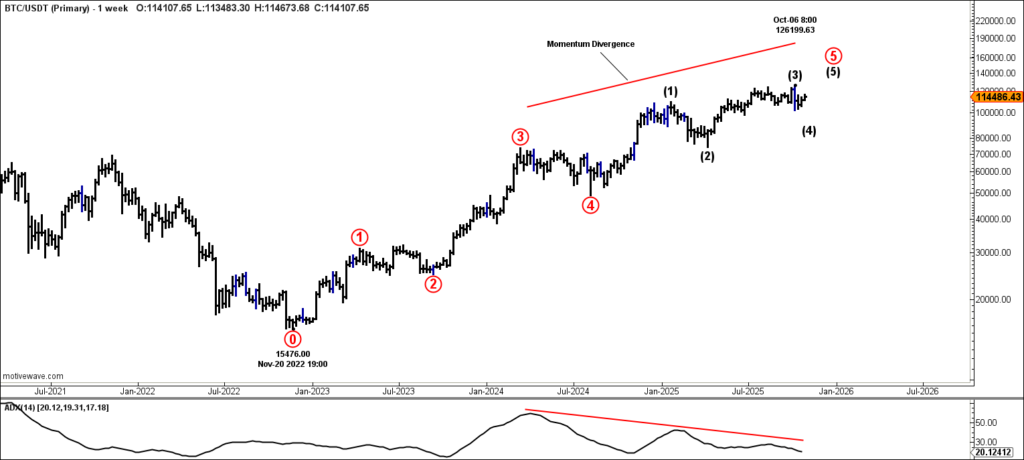
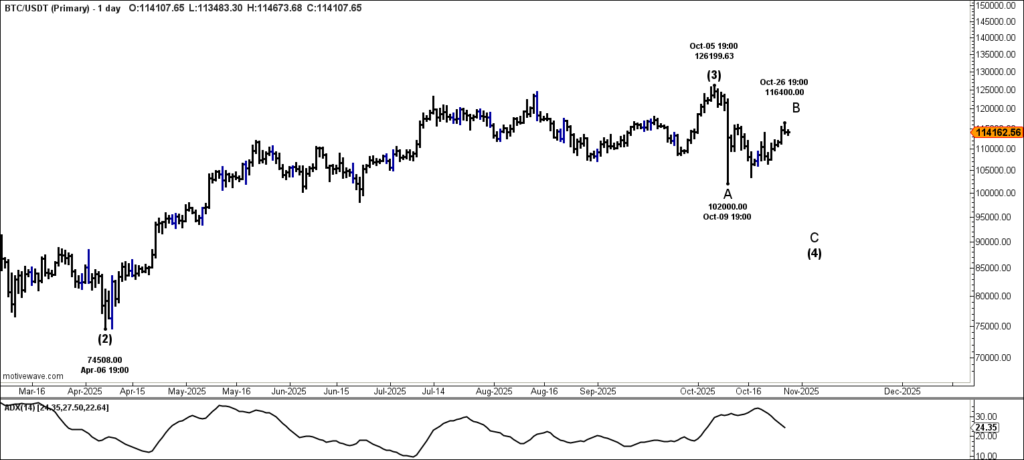
While the sharp decline that followed had the characteristics of a post-diagonal reversal, price quickly rebounded from the $102,000 area and has since consolidated around the $110K level throughout October. This behavior indicates that the ending diagonal may still be extending, implying that a final push to new highs could occur before the larger trend reverses.
Additionally, the decline from the $126K top appears corrective rather than impulsive, supporting the view that it represents a zigzag pattern for Intermediate wave (4) within the ongoing diagonal structure.
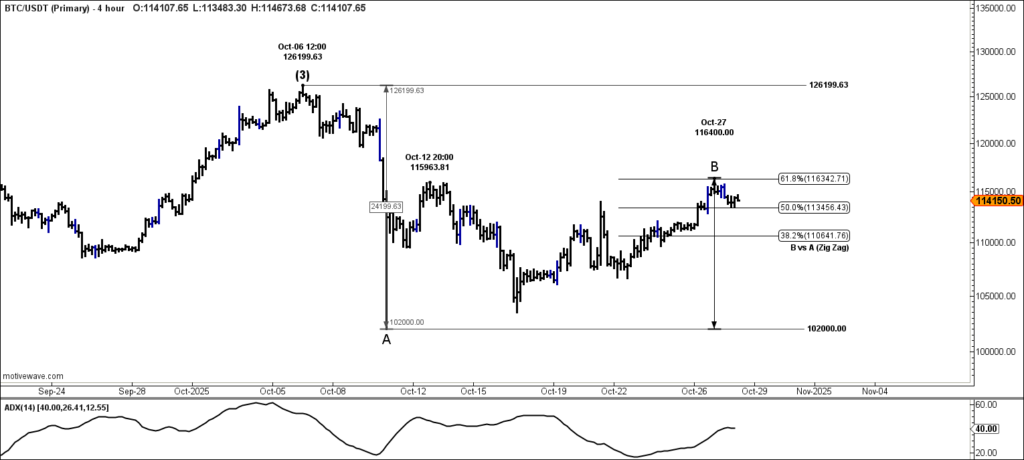
BTC/USDT Binance 4-hour chart. Price has dropped below the October 13 high, signaling a possible end of Minor wave B near the $116,400 high from October 25. Today, Bitcoin price opened at $114,107 and has since moved up to around $114,900, remaining below the October 13 level.
A move above the October 13 high would extend Minor wave B slightly higher. However, if Bitcoin price continues to hold below that level, a drop through the Fibonacci retracement zone (Minor B vs A) would confirm the start of Minor wave C.