Featured chart by StockCharts.com
Technical analysis by Raul Fernando Luna Toro
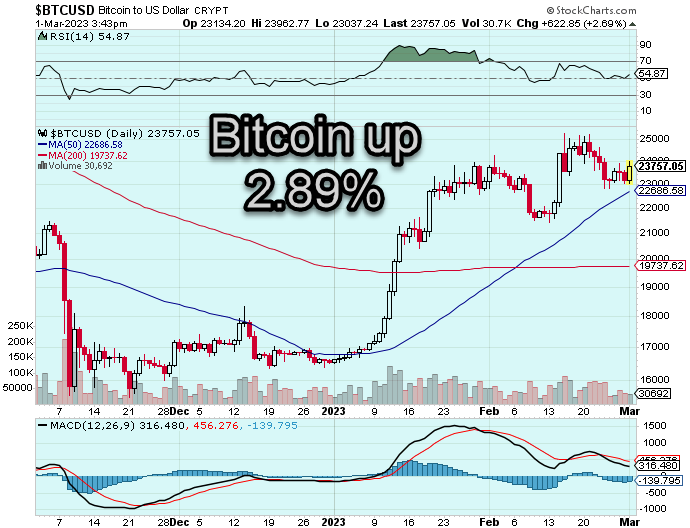
Daily price action
Bitcoin is up +2.89% so far this morning. The benchmark crypto opened at 23134.20 moved down to a low at $20037.24 before moving up strongly to a intraday high of $23962.77. Currently, price is trading at the $23757.05.
Elliott Wave analysis
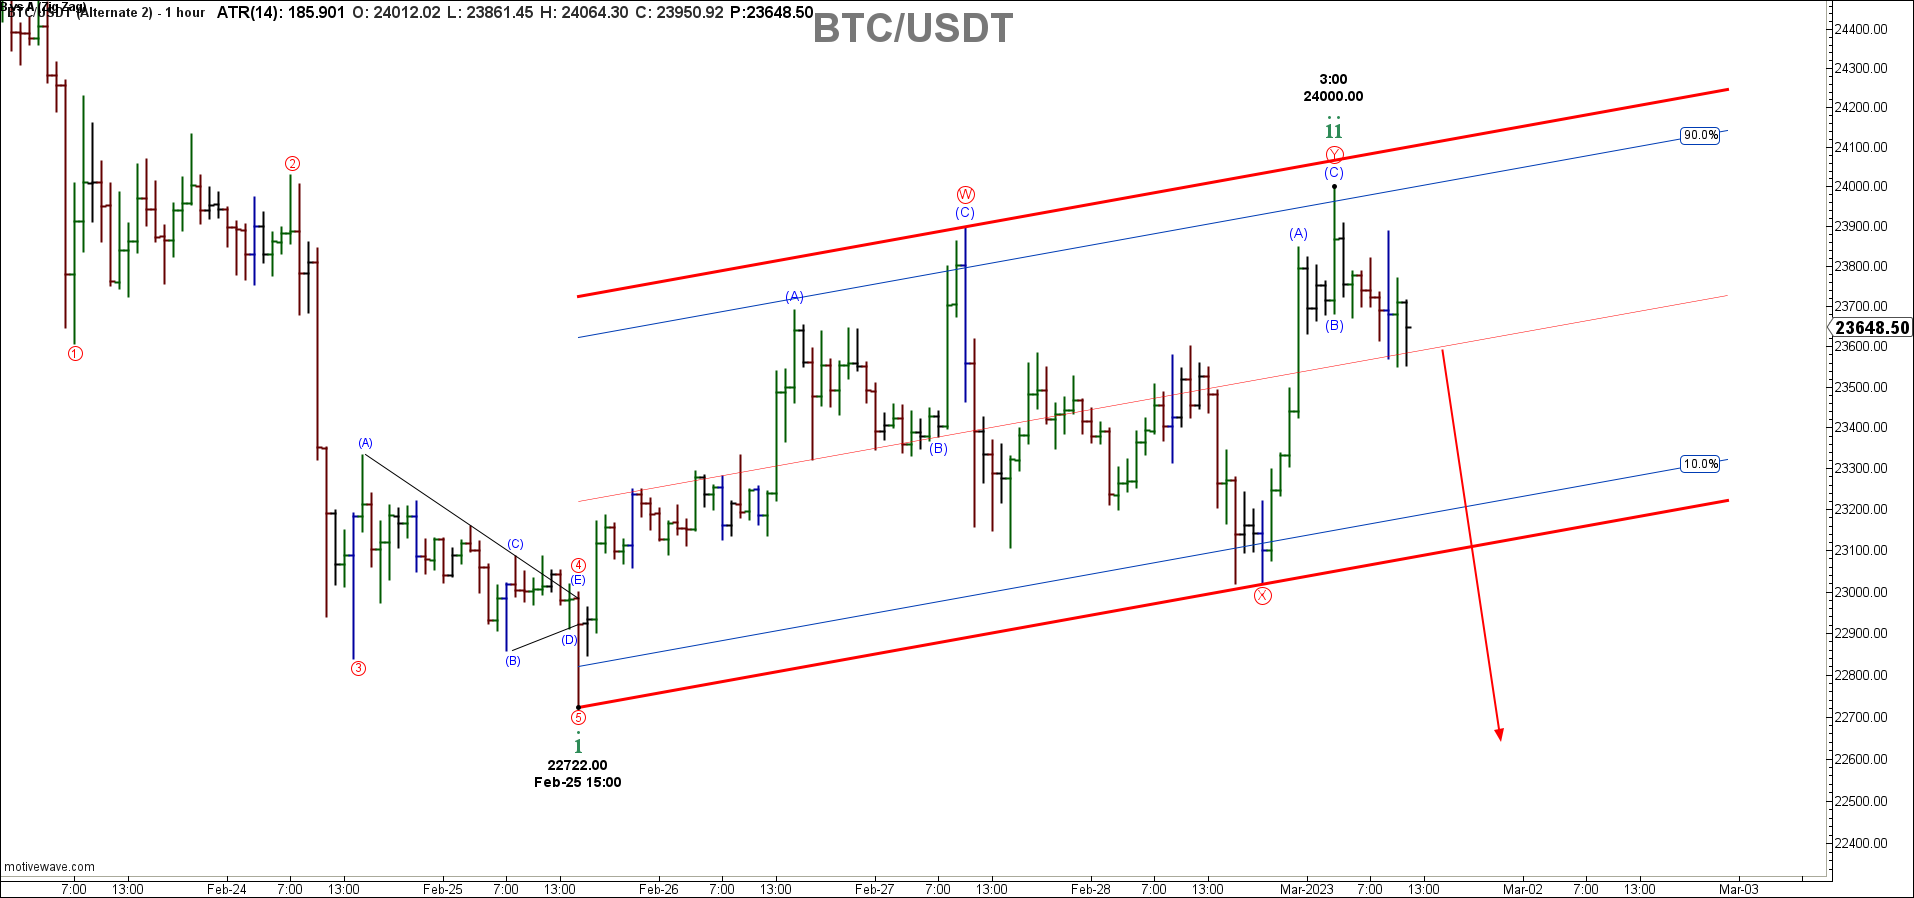
Last night BTC/USDT tested Minor Degree lower channel trend line support for the second time in five days. Today’s range is outside yesterday’s candle signaling a possible reversal of the downtrend from the $25250.00 February high. However, I think this is unlikely as the Elliott Wave structure is still intact and warning of a deeper correction of the impulse up from the $15476.00 November low.

Decomposing down to a 1-hour chart, one can see that a double zigzag has formed at the $24000.00 high. Notice also that price has since dropped off and is now testing the Micro Degree middle channel trend line support for the third time in three hours.
The risk is to the downside. Once again, look for buying opportunities at Fibonacci levels: $20943.40 38.2%, $19767.88 50.0%, $18656.34 61.8%.
Please follow and like us: