Featrued chart by StockCharts.com
Elliott Wave Analysis by Raul Fernando Luna Toro
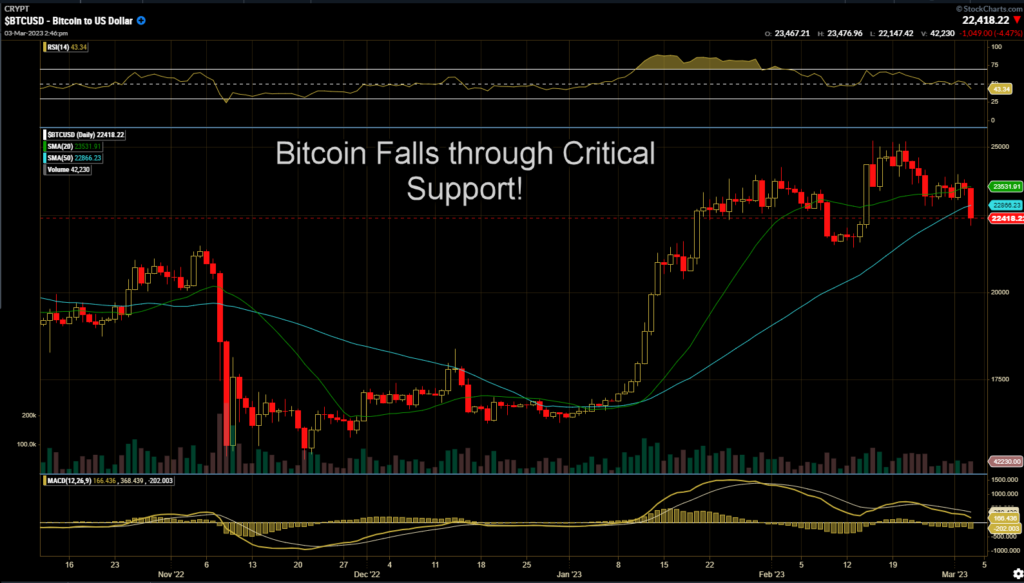
Bitcoin Price Action
Bitcoin USDT Binance opened at $23465.32 moved up slightly to an intraday high of $23476.95 then dumped through support to an intraday low of $21971.13. The benchmark crypto is now trading at the $22339 and change.
BTC/USDT Elliott Wave Analysis

BTC/USD pushed through Minor Degree low channel support last night and should be on its way to Fibonacci 2vs1 support. A breach of the $21351.07 Feb 13 Minor Degree wave 4 low signals the drop to Fibonacci levels: 38.2% $20943.40, 50.0% $19767.88, 61.8% $18658.34
US 10 Year Bond Yield
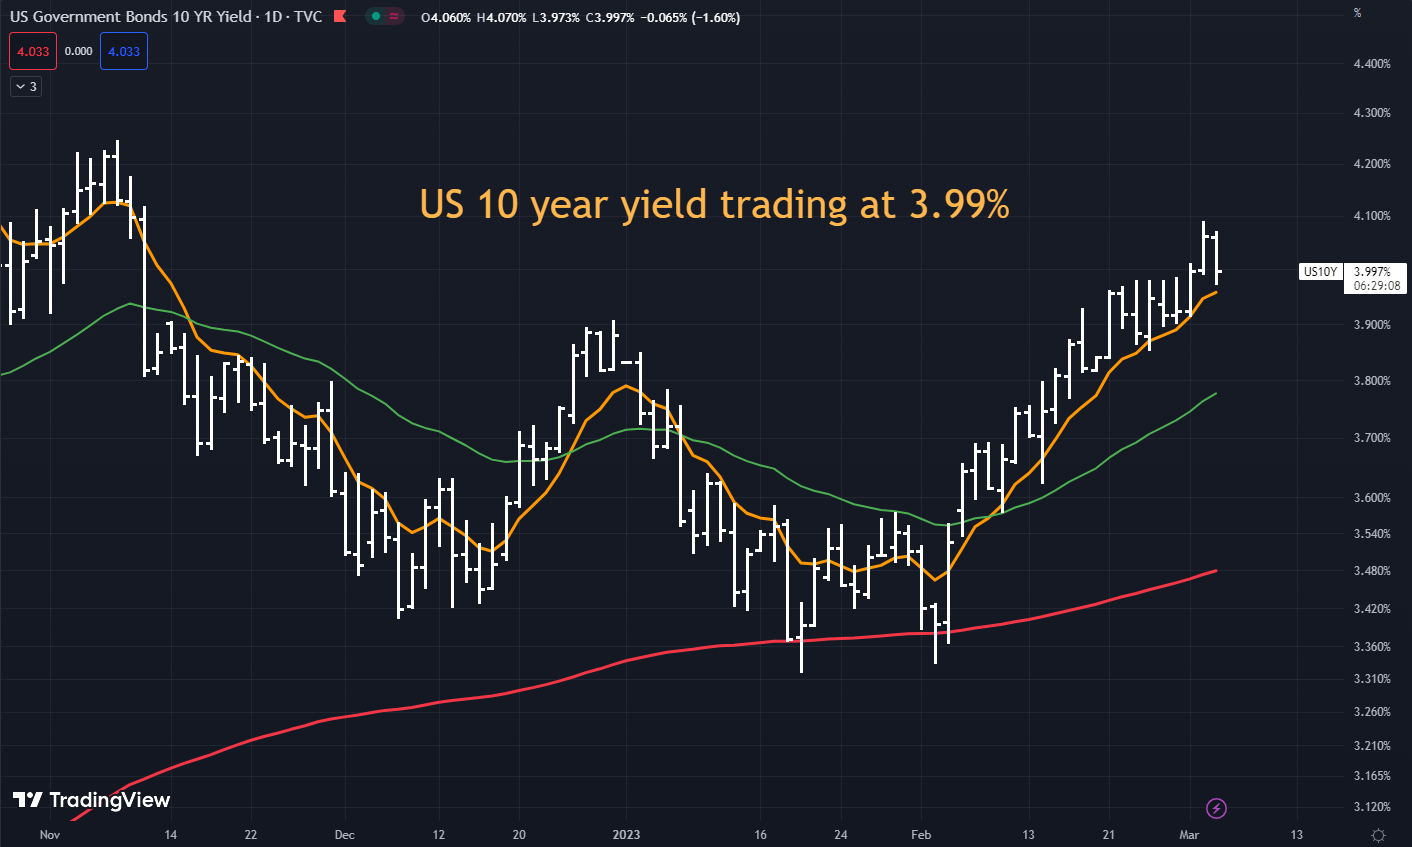
TradingEconomics.com
According to TradingEconomics.com Wall Street opened higher, European shares extended gains, China Services improved in February, Italian Services expanded for February and Spain’s Service sector grew to a 10 month high.
US SPX500 Elliott Wave Analysis
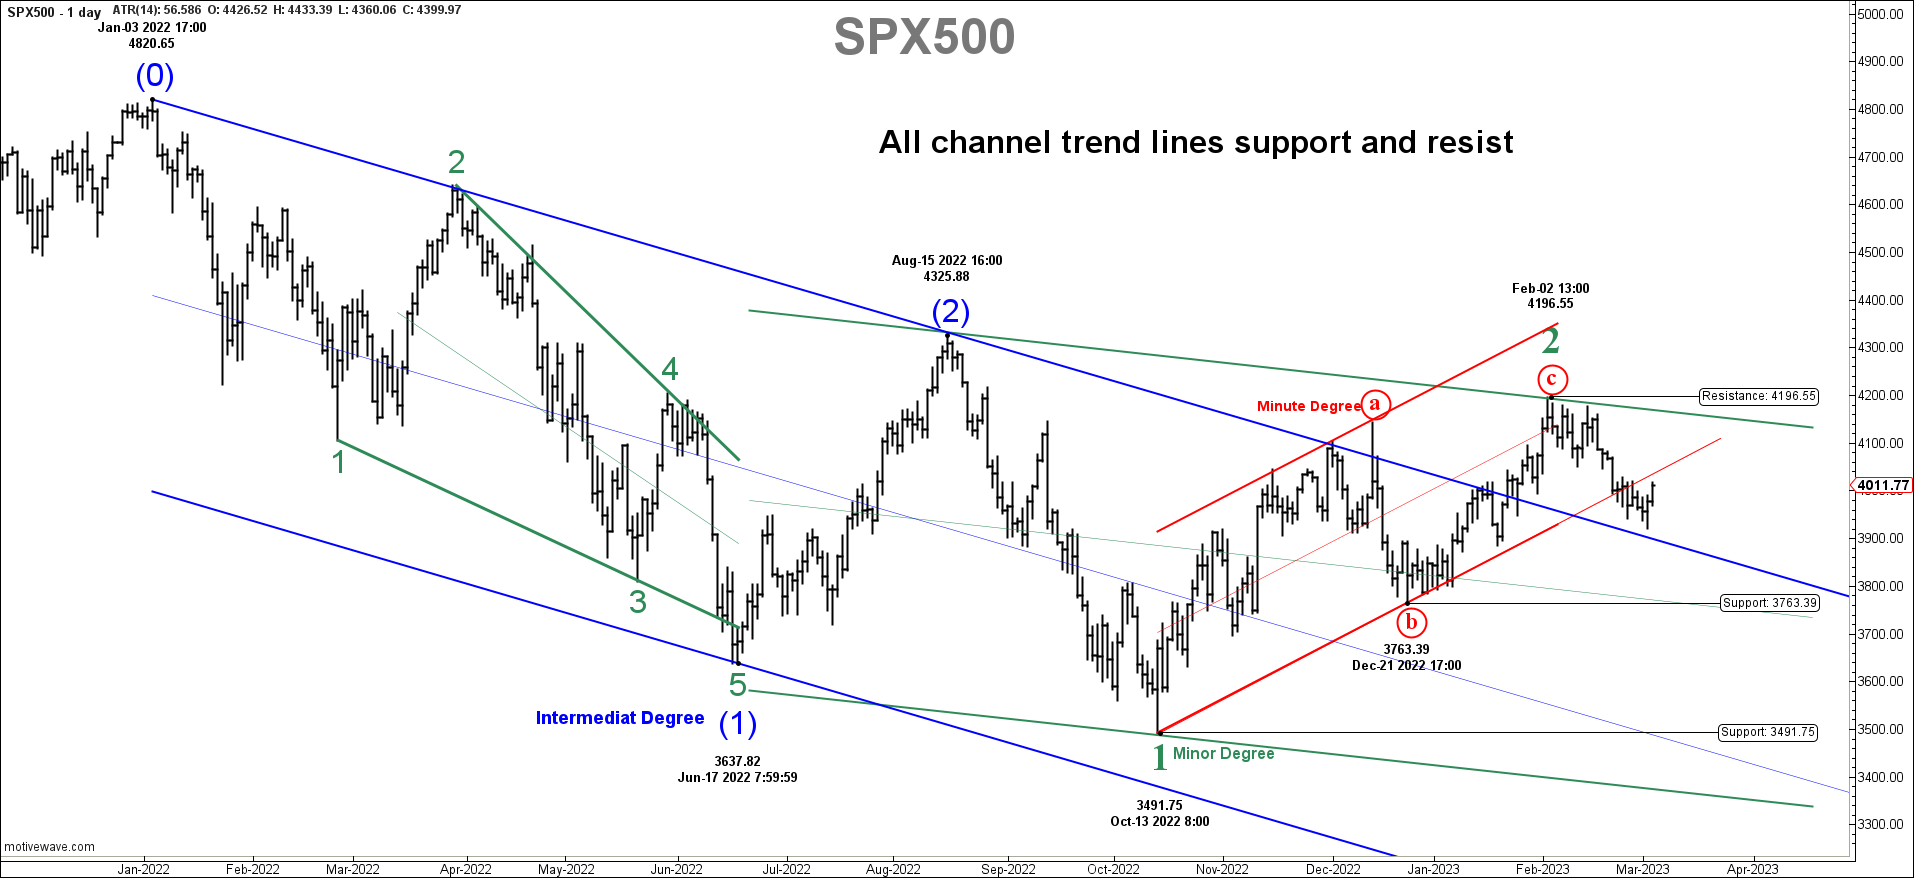
The United States SPX500 is positive for second day as sentiment improves a bit. However, the longer term risk is still to the downside. The Elliott Wave structure is still intact with today’s price action below the Red Minute Degree Channel and 4.53% below 4196.55 Minor Degree high put in on Feb 2. Notice that Minor Degree 2 has moved outside the blue 1-2 Intermediate Degree channel zone. This is the only sign supporting a move to the upside. However, these outside moves do occur. The important downside signals which is the Elliott Wave structure is still warning the longer term downside move.
It is time to get ready to buy a Fibonacci 2vs1 support levels!
Please follow and like us: