
Economía
🪙 Bitcoin Elliott Wave Analysis October 2025 | Primary Wave 5 Outlook
16 October 2025 · [email protected]
Bitcoin Elliott Wave Analysis October 2025: Date: Oct 16 2025 | Exchange: Binance (BTC/USDT) | Timeframe: 1 h / 2 d / 1 w
Price: $108 121 (10:27 a.m. NY) | All-Time High: $126 199 (Oct 4)
Bias: Neutral → Bearish unless price reclaims > $112 000
Scenarios:
Key Levels
| Zone | Level | Comment |
|---|---|---|
| Resistance | 110 000 – 112 000 | Former support / EMA ceiling |
| Fib 38.2% (4 vs 2) | 109 242 | Current pivot zone |
| Fib 61.8% (4 vs 2) | 99 684 | Critical support |
| Equality (4 = 2) | 85 952 | Invalidates contracting form |
| All-time high | 126 199 | Potential terminal (5) top |
Bitcoin just lost the $110 000 support, confirming short-term bearish momentum.
This 1-hour chart applies the Wavy Tunnel EMA system — a key part of this Elliott Wave analysis.

| EMA | Value | Slope | Comment |
|---|---|---|---|
| 8 EMA (green) | ≈ 109 957 | strongly down | below all 34 EMAs |
| 34 high/low EMAs (red) | ≈ 111 637 / 110 881 | turning down | bearish ribbon formed |
| 144 EMA (light blue) | ≈ 113 486 | slightly positive | tunnel floor now broken |
| 169 EMA (dark blue) | ≈ 113 938 | flattening | resistance on rallies |
The short-term structure has flipped fully bearish.
Price is now trading below the 144/169 EMA tunnel, with the 8 EMA crossing under the 34s — a textbook downside acceleration.
DMI (14): −DI = 34.7, +DI = 8.6, ADX ≈ 32 → confirmed trend strength.
Volume spikes during the break add credibility to the selloff.
➡ Interpretation: A temporary bounce to 110 – 111 k could retest resistance, but a close < 107 800 would open 104 – 102 k.
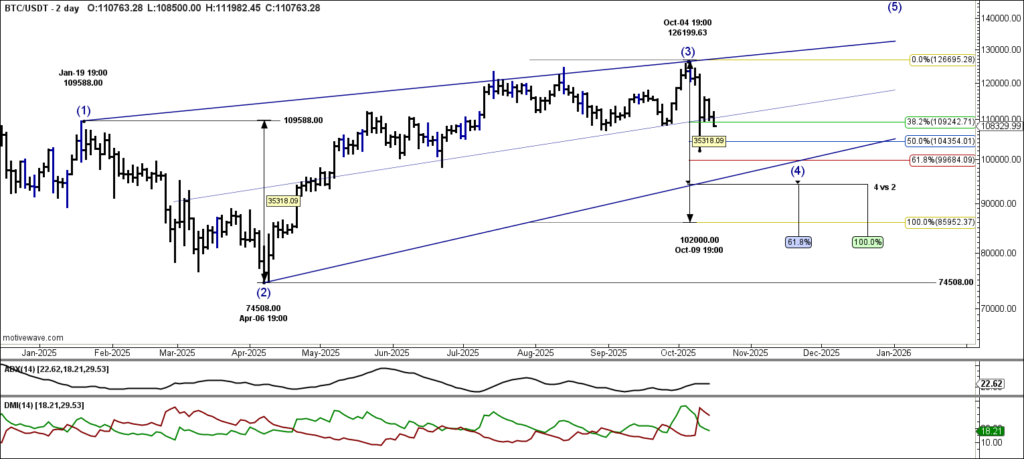
From the Nov 2022 low @ $15 476, Bitcoin has advanced in a five-wave Primary Degree impulse.
The Primary 2–4 channel (red) has now been decisively broken, signaling a terminal fifth wave.
Two possible paths now:

Wave (4) retraced ~50% of (2) in price — smaller in both price and time, consistent with a contracting diagonal.
The Fibonacci zone between 38.2 % (109 242) and 61.8 % (99 684) defines the structural range.
| Metric | Reading | Interpretation |
|---|---|---|
| 4 vs 2 price ratio | ~61.8 % | ideal contraction |
| ADX (weekly) | ≈ 22 | trend maturity |
| +DI / −DI | flat / rising | early bearish shift |
Momentum is fading, typical near terminal diagonals or major cycle tops.
Bitcoin’s Primary Degree impulse from the $15 476 2022 low is nearing completion. The Oct 4 all-time high at $126 199 may have marked Intermediate (3), with (4) completing near $102 000.
Holding above $99 600 keeps the diagonal alive and allows for one more high toward $128 – 132 k.
A break below that level confirms Primary (5) has topped, starting a longer corrective phase that could last months.
| Scenario | Trigger | Target | Implication |
|---|---|---|---|
| Bullish Extension | Close > 115 000 | 128 000 – 132 000 | Final diagonal spike |
| Bearish Reversal | Close < 99 600 | 85 000 → 75 000 | Primary (5) top confirmed |
| Neutral Range | 100 000 – 112 000 | Sideways | Transition zone |
Bitcoin perdió el soporte de $110 000 y el sesgo inmediato es bajista. Sin embargo, la estructura de largo plazo bajo el Análisis Elliott Wave de Bitcoin Octubre 2025 muestra que la onda 5 Primaria aún podría extenderse si el precio recupera $112 000 – $115 000.
Una caída por debajo de $99 600 confirmaría un techo de ciclo y abriría el camino a una corrección hacia $85 000 – $75 000.
Niveles clave: 112 000 / 109 000 / 99 600 / 85 000