Economía
DOLLAR SOL FORECAST!
26 June 2023
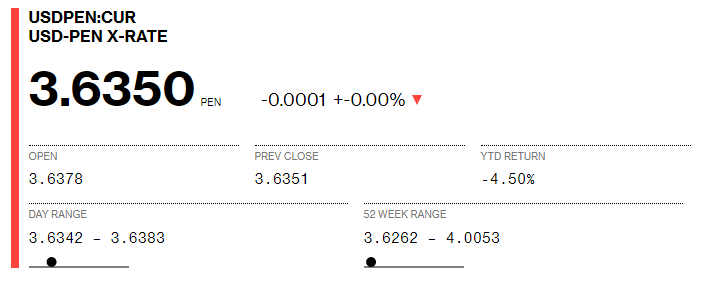
US DOLLAR SOL S/. 3.6350, Bitcoin $30,442.43, Gold $1,924.89, US Oil $69.02, Copper $3.78
US Dollar Sol opened S/.3.6378 this morning and setteled back down at the S/.3.6350.
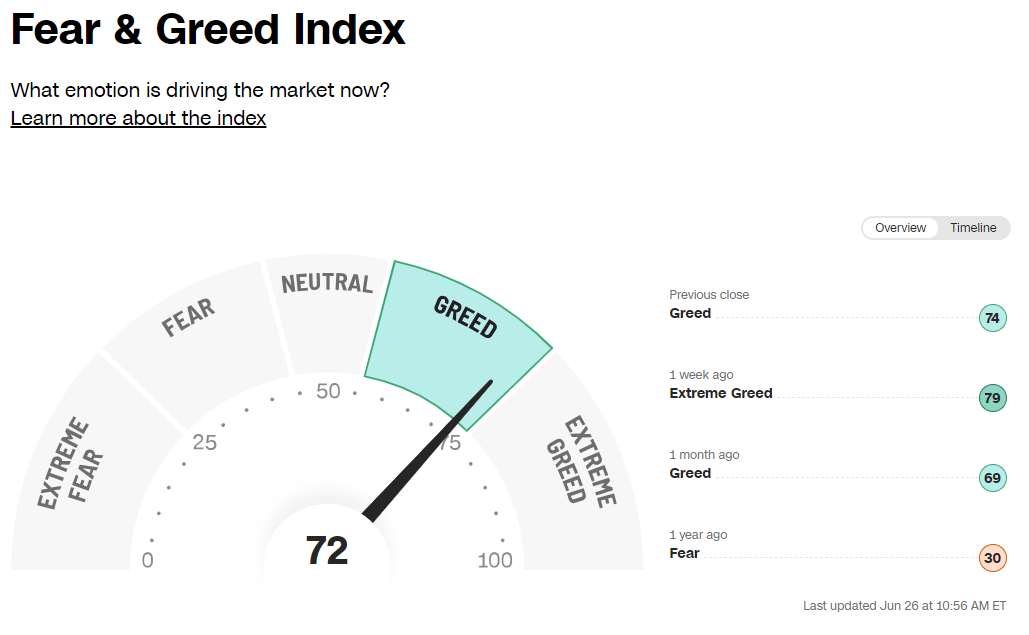
Sentiment is rebounding in the United States, evident by the Fear/Greed index reaching 72 and the S&P 500 climbing to $4354. However, these developments have had minimal impact on the Dollar Sol performance. Since reaching a record high of 4.13 in 2021, the US dollar has remained weak against the Sol. Even the recent banking crises failed to dampen risk assets significantly. Notably, the Sol has emerged as one of the strongest currencies in the Forex markets during this noteworthy period.
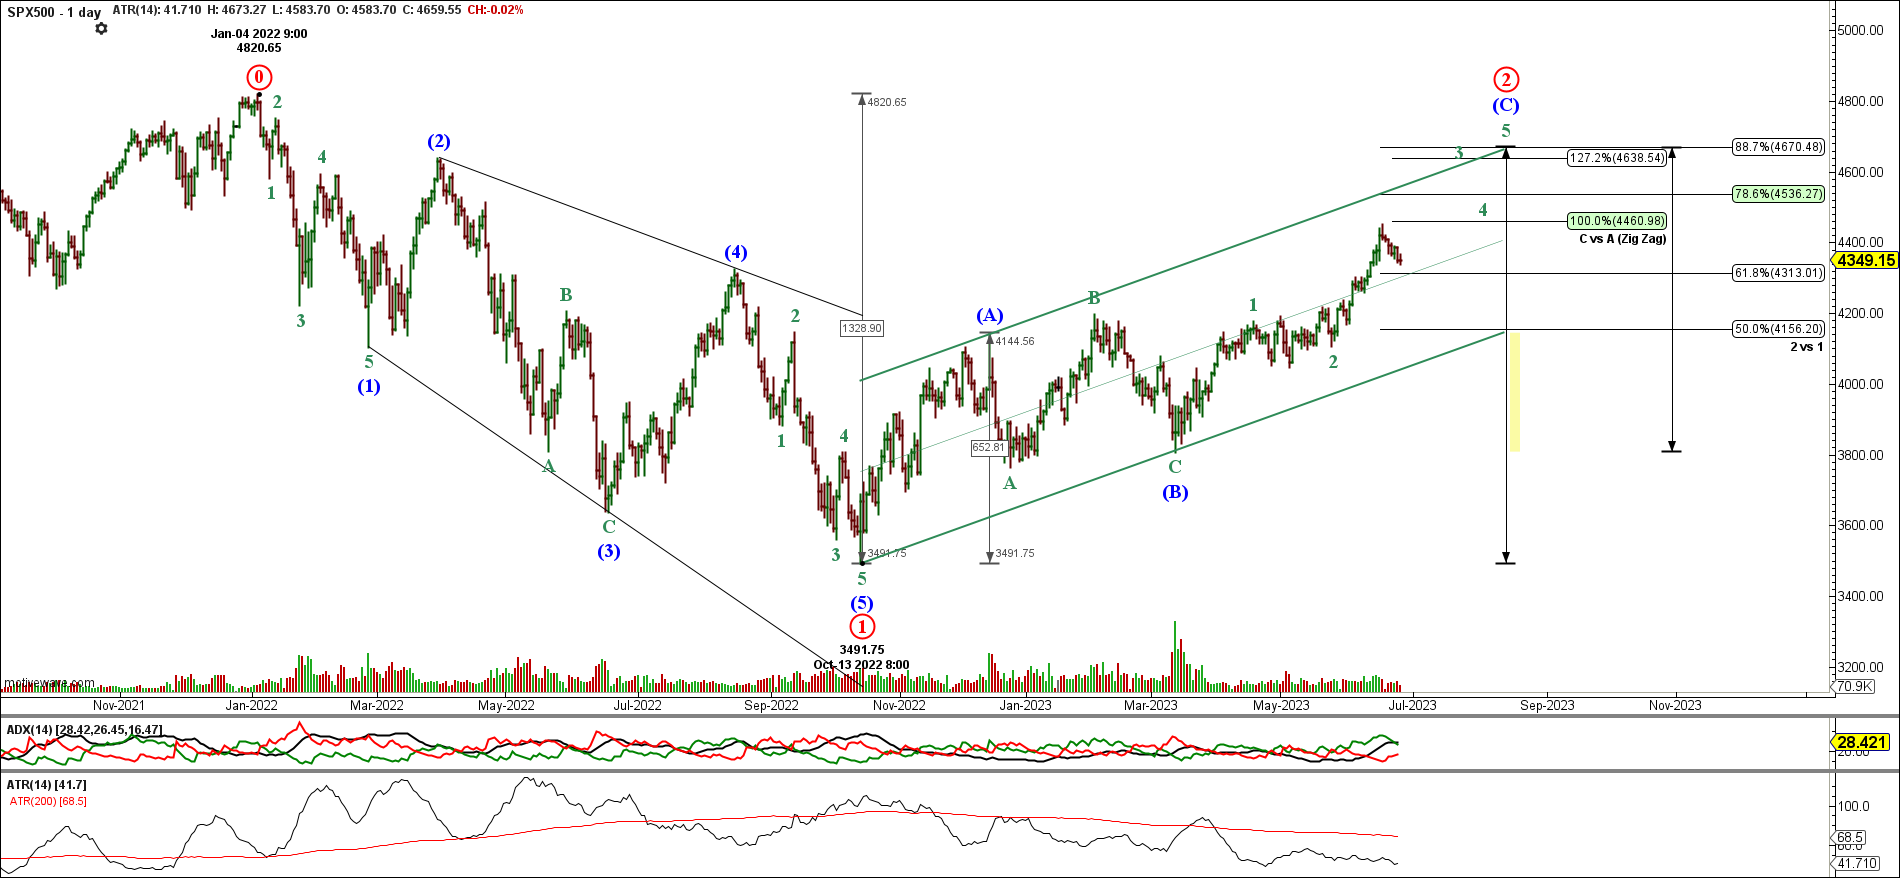
Presented below is a daily bar chart depicting the US S&P 500 (SPX500) performance. The Elliott Wave labeling forecast anticipates a forthcoming bearish movement subsequent to the index attaining the $4670 Fibonacci projection zone near the upper channel resistance. Although there exists an alternative count proposing the possibility of new all-time highs, its likelihood is currently deemed low due to the completion of a five-wave count at the $4820 all-time at Super Cycle degree. Consequently, the bearish count retains its validity until the upper channel breach occurs.
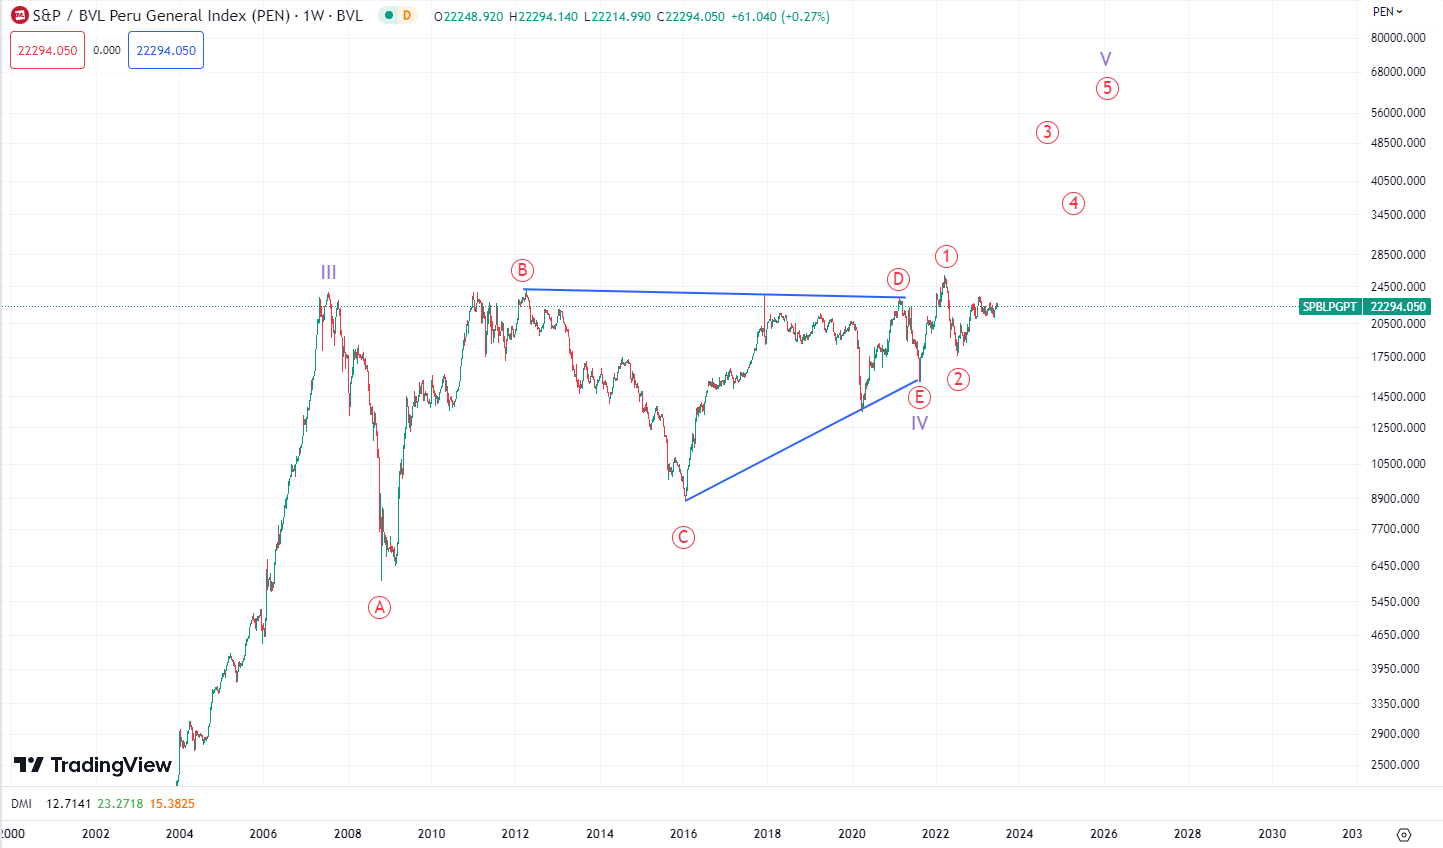
Below is a chart illustrating Peru’s General Index. The current pattern suggests the development of an impulse wave, specifically a terminal fifth wave, with the potential to drive the index to new record highs. Notably, this impulse has already completed its initial series of 1-2 wave formations. Notice that a triangle pattern reached its conclusion in 2022 which gave way to this impulse. The outlook for Peru’s index and its economy, which heavily relies on commodities, appears favorable. The emergence of Bitcoin and the presence of inflation as a supportive factor for commodities has been contributing to the resilience of both the Sol currency and Peru’s stock index. Given this relative posstion, Peru should out perform the US and the G8 for sometime to come.
The USD/PEN chart below is a long-term log chart dating back to the Sol’s beginnings in 1999. The dollar experienced a sharp surge against the Sol, reaching S/.3.6480 by 2002. Following that, the pair traded within a range, displaying characteristics of an expanded flat formation. Currently, the pair has completed its initial A-B waves at the S/.4.13 high in 2021. Consequently, it is highly probable that the pair is now in its C wave, poised for a downward movement to test the S/.2.53 low from 2013.
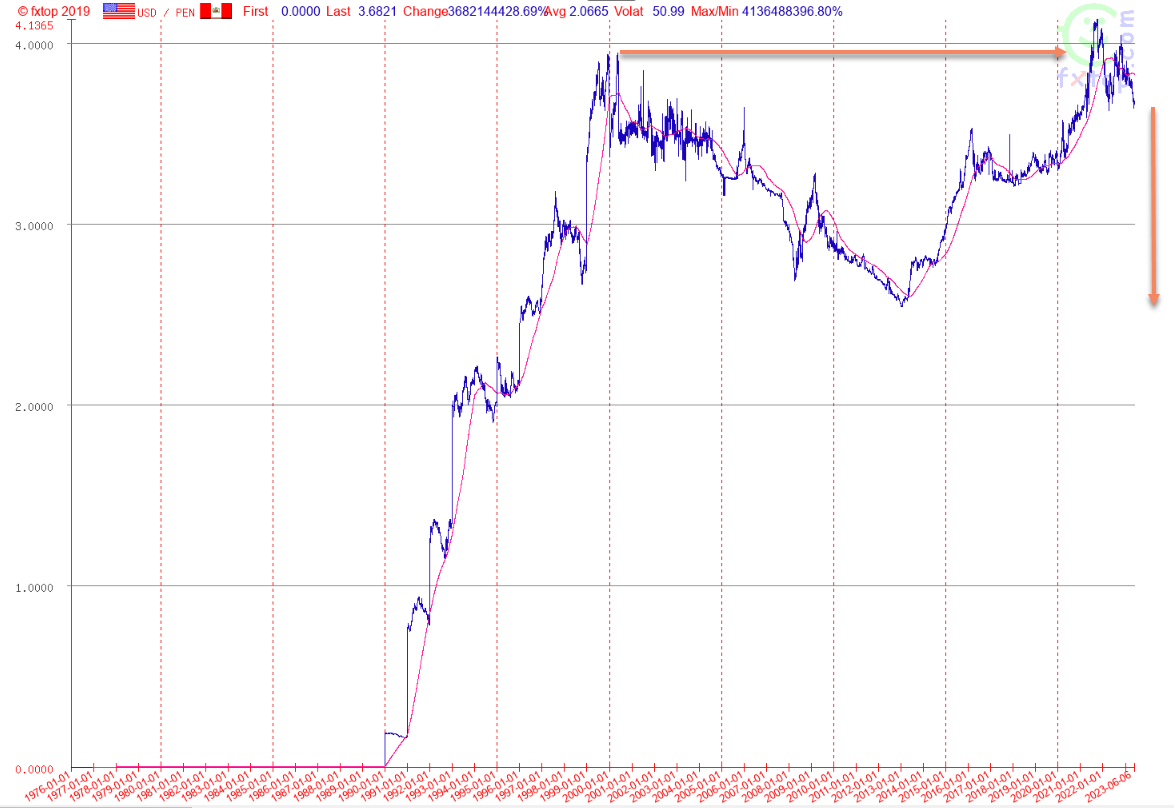
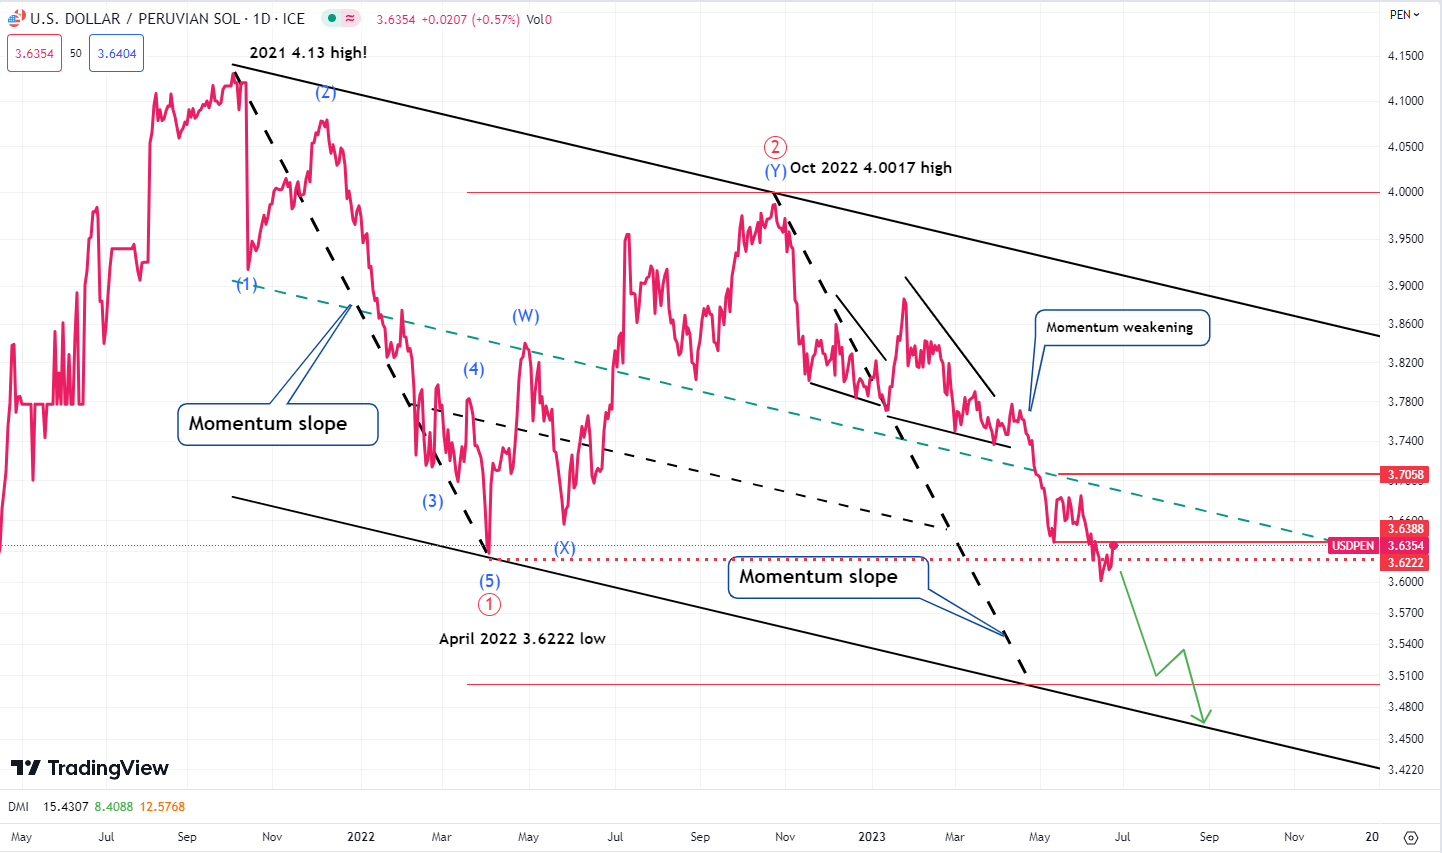
The USD/PEN daily bar chart is currently forming its second bearish wave, following the high of S/.4.13 in 2021. The first wave retraced to the S/.4.00 high in 2022 before resuming its downward movement in the current wave. The wave count is at the Primary Degree level. The anticipated downside move is expected to encounter significant resistance at the lower channel trend line support. However, if this wave count proves accurate, the pair is likely to break through this resistance and continue its bearish decline towards the mid S2.50s.