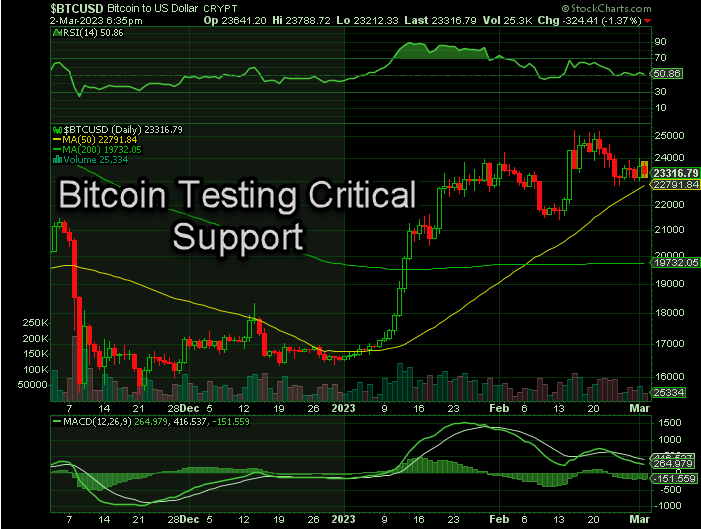
Featured chart by StockCharts.com
Elliott Wave analysis by Raul Fernando Luna Toro
BTC/USDT opened today at $23629.76 put in an intraday high of $2376.93 and intraday low of $23195.90. The crypto is now trading at $23303 and change. Average True Range for the last 14 days is $994.089 bucks a day.
Elliott Wave Analysis Daily Log
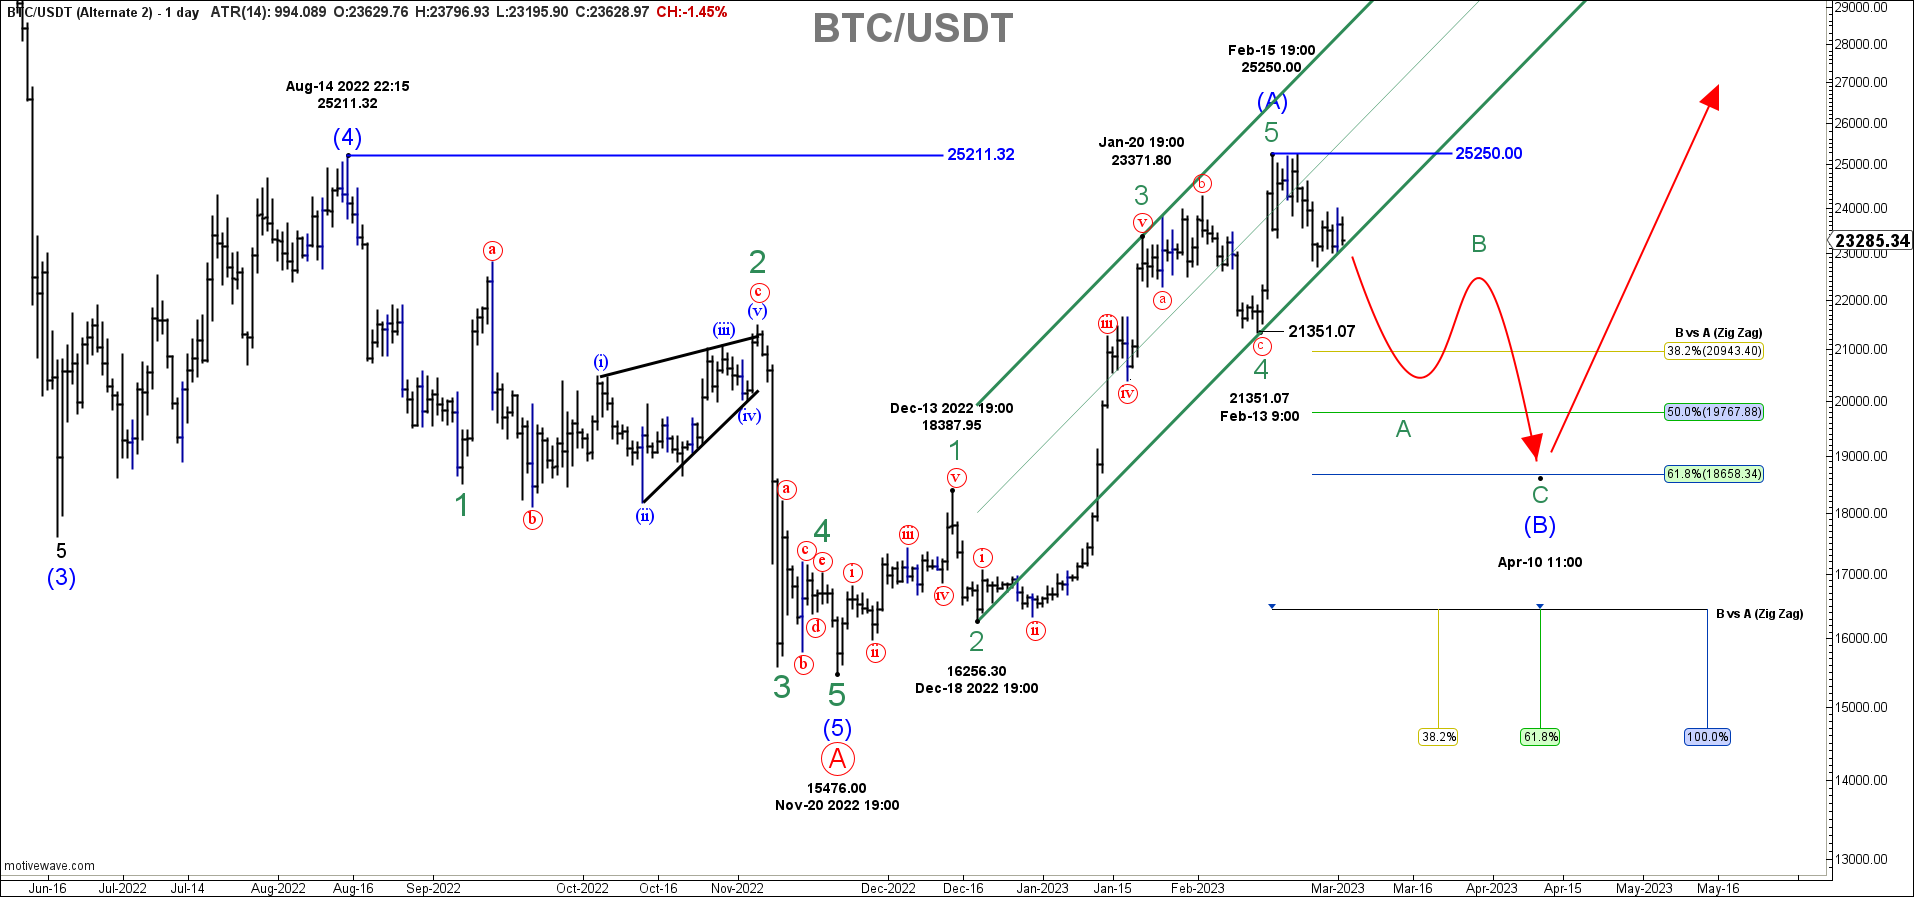
Price is currently testing the Minor Degree lower channel trend line again for the 3rd time in six days. Once this trend line is breached the benchmark crypto shouldn’t have any problem reaching the $21351.07 Minor Degree 4 low put in on Feb 13.
From there, Bitcoin buying opportunities begin. Targets are at the Fibonacci 2vs1: 38.2% $20943.40, 50.0% $19767.88, and the 61.8% $18658.34
Elliott Wave Analysis 1 Hour Log
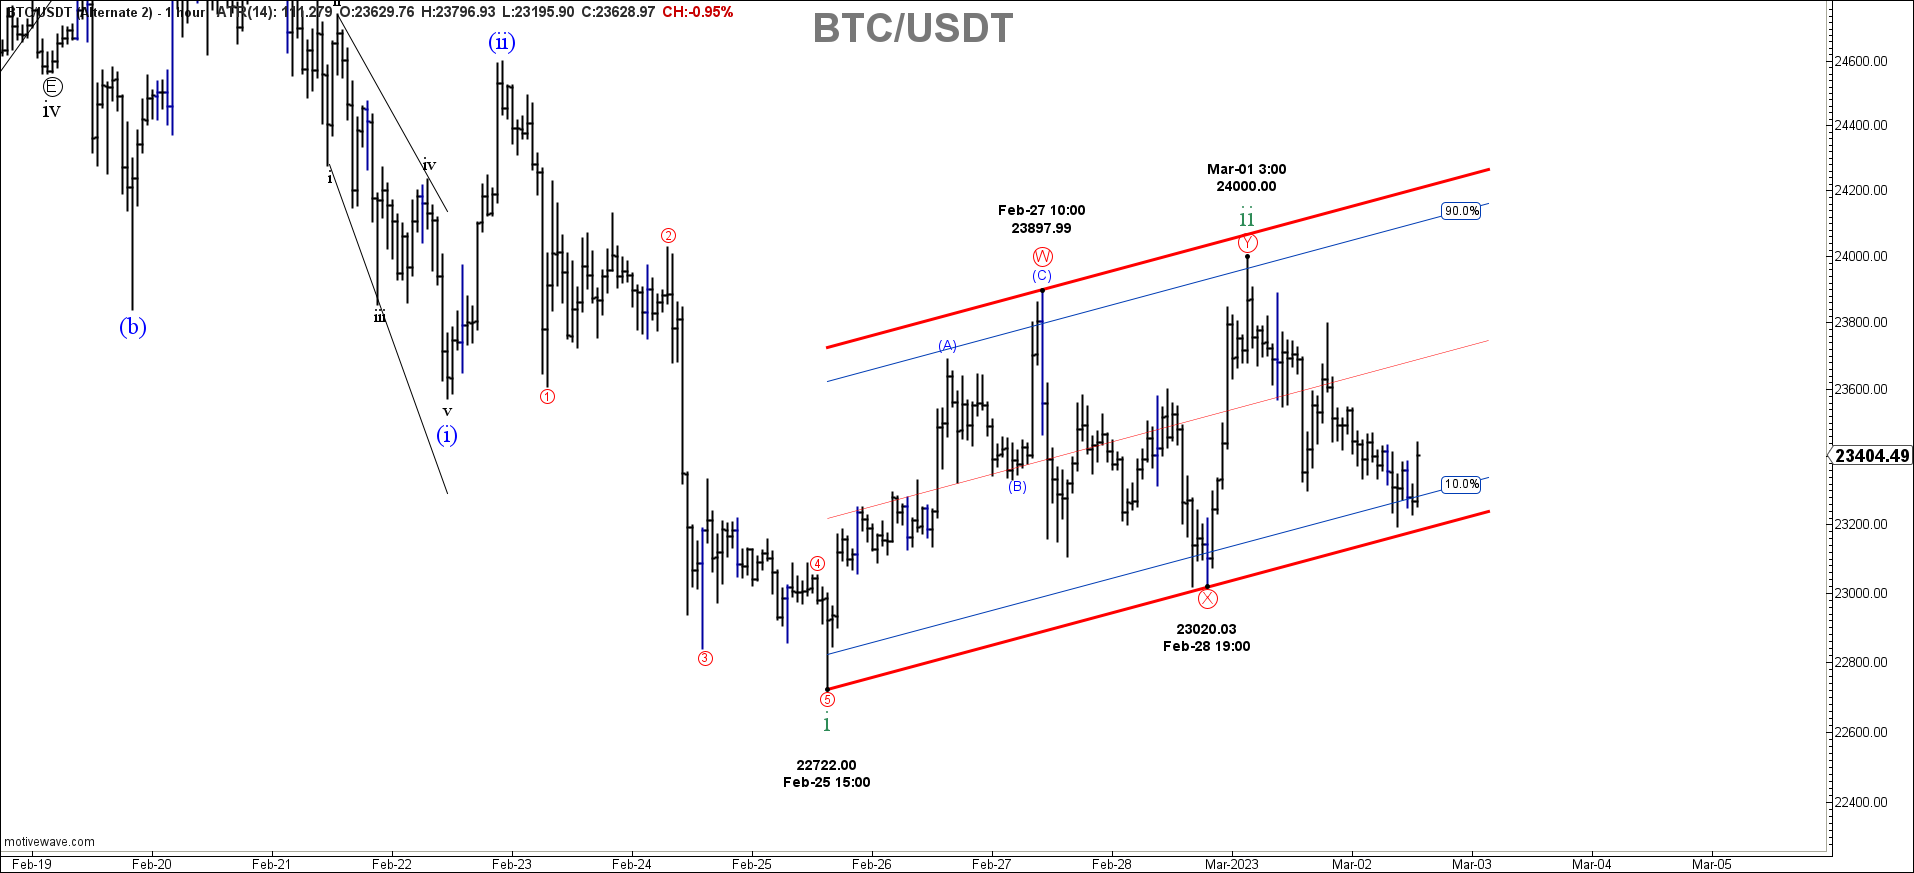
Above is a 1-hour chart showing the bounce of the Micro Degree lower channel trend line. Price is expected to remain under the mid channel trend line and retest and fail at the lower trend line. However, if price keeps climbing as it is now, we want to see a move above the middle channel tend line with a daily close. This will warn of a move to another test of the upper channel trend line and the $24000.00 March high.
Price Momentum
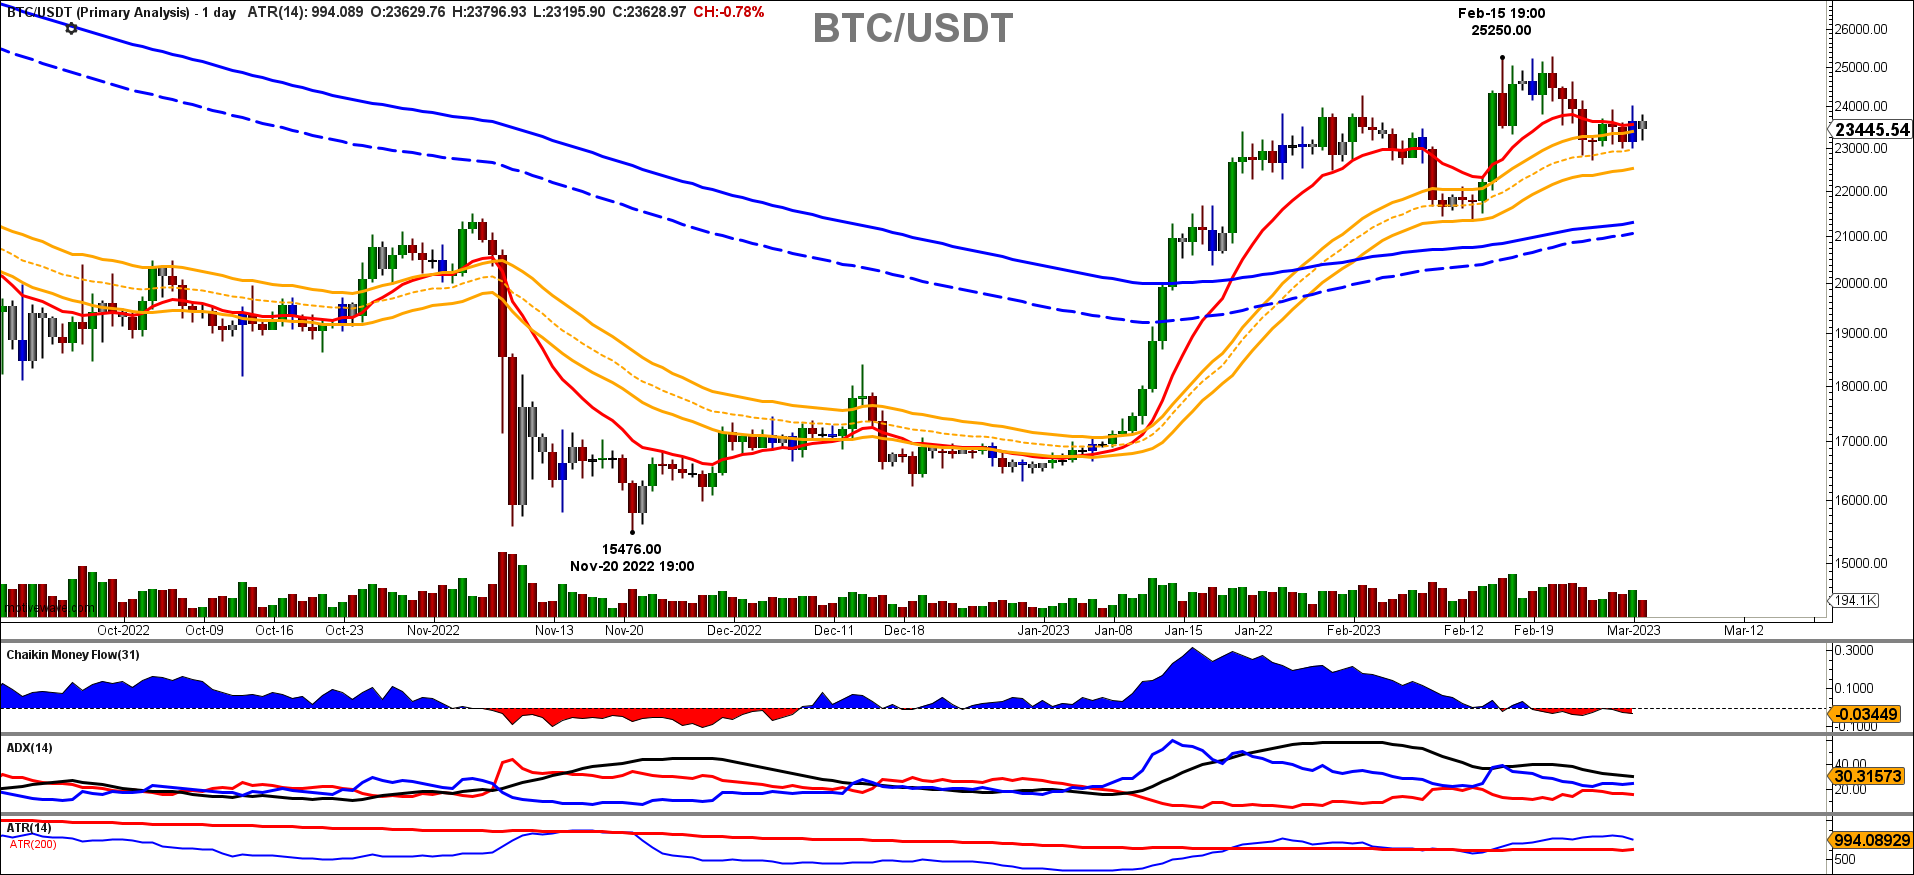
Price is now testing the red 8-day period EMA at the $23000.00 psychological level. The 8 period EMA has fallen against the orange upper 34 period EMA wave and is now putting in negative figures. The orange 34 EMA wave is still putting gin positive figures however about to turn. Price is about 9.93% above the 144/169 EMA tunnel which signals greed. But once again, this should not last. Notice that Chaikin Money flow is signaling that the bulk of the 14-day average volume is now favoring the downside. 14 period ADX is ticking strongly at 30.31 with +Di on top of –Di which is still bullish. ATR as mentioned above is ticking at 994 buck average for the last 14 days.
In short momentum is still favoring the upside. However, the Elliott wave structure is telling us the Intermediate degree impulse is most likely complete.
Please follow and like us: