Economía
EUR/USD Pulls Back slighty to $1.093
19 June 2023
EUR/USD drops to the $1.093 this morning. Despite the fall, longer term the Euro looks strong against the dollar. Technical and Elliott Wave stucture looks bullish for EUR/USD.
European stock exchanges experienced a decline, today, in response to renewed investor worries regarding economic growth prospects. The DAX, a major stock index in Germany, dropped by approximately 0.4%, while the STOXX 600, a broader European stock index, experienced a 0.5% decrease. The decline was primarily driven by losses in chemical and construction companies, which outweighed the gains observed in banking stocks.
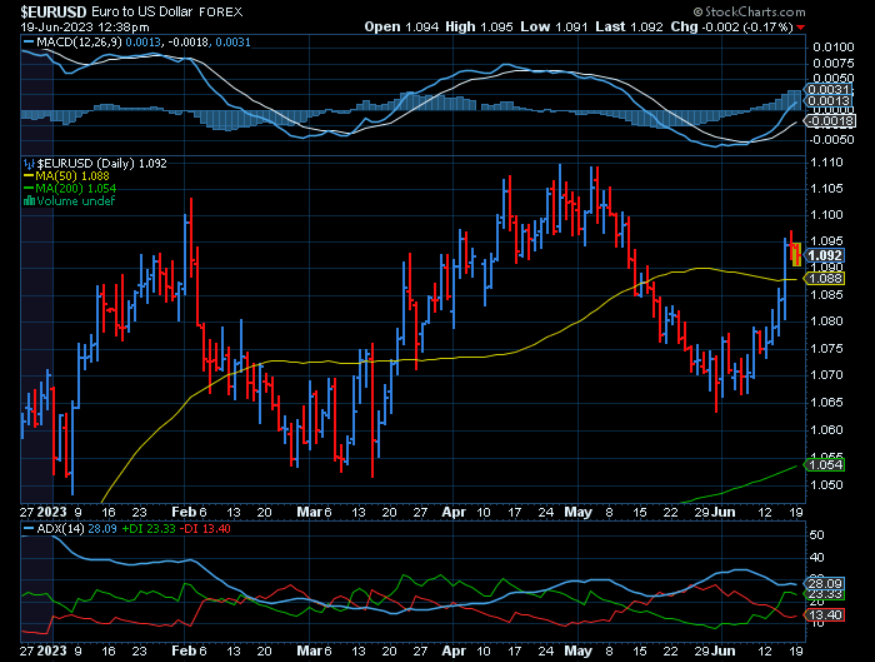
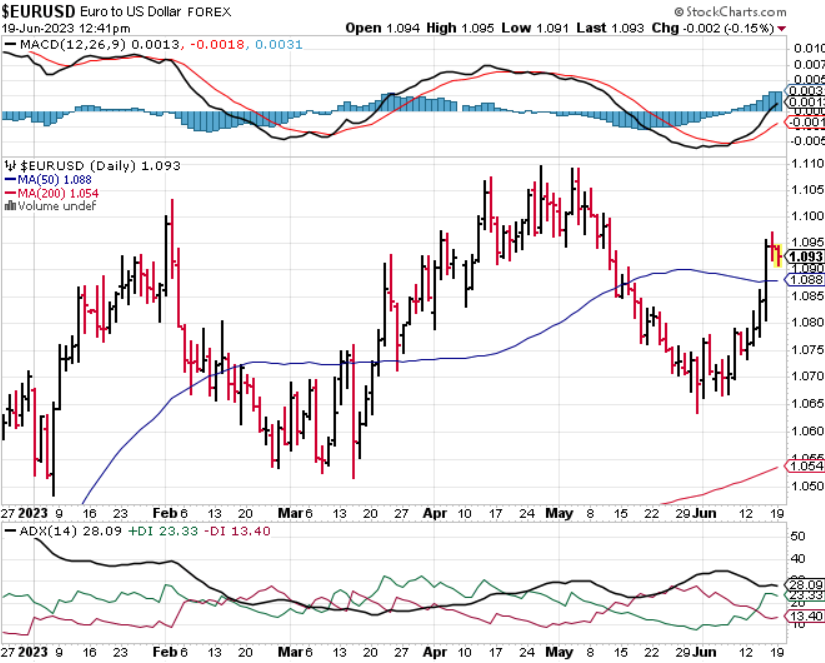
The Euro’s long-term outlook appears bullish against the US dollar, despite the recent decline. The Moving Average Convergence Divergence (MACD) indicator is positive, with the signal line currently above zero, suggesting further potential upside. Additionally, there is room for the indicator to rise further. The recent pullback in the Euro’s value should be seen as a corrective move within the upward trend that started with the rally in early June. Although the Average Directional Index (ADX) has slightly cooled down, it still indicates a bullish trend with a value of 28.09.
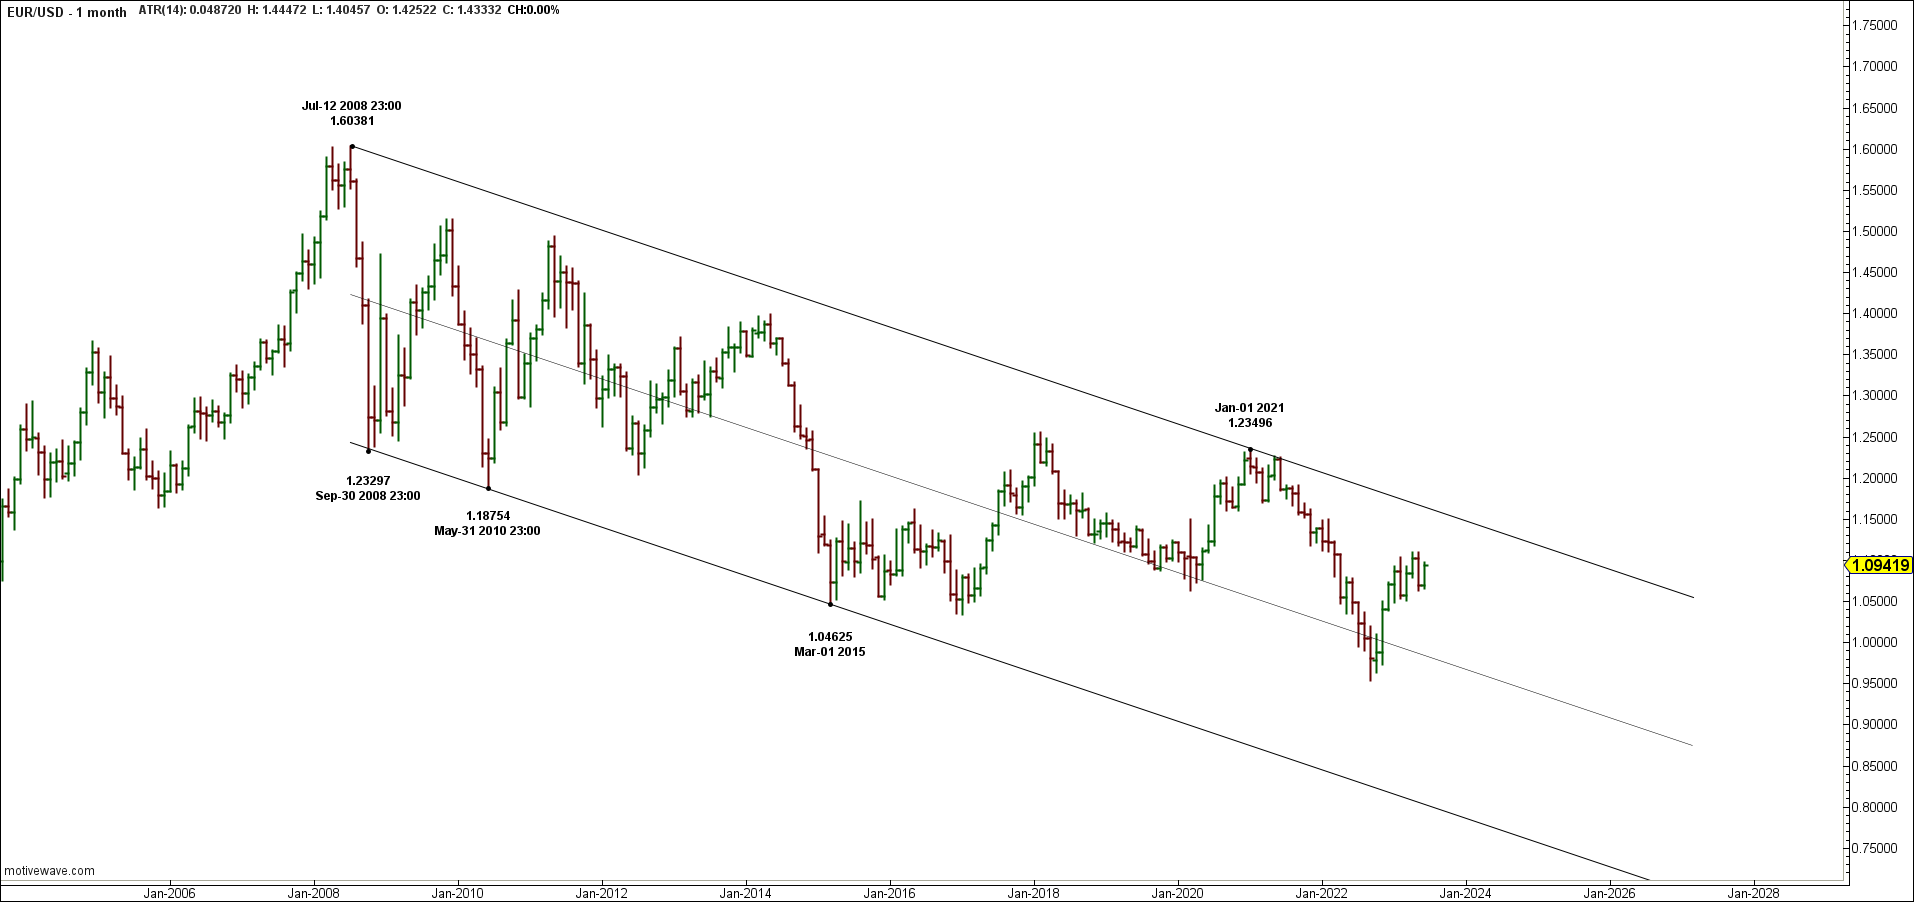
The ongoing downward structure from the $1.6038 2008 high appears to be a double zigzag at the Cycle Degree. There are a few different ways to count this structure, but the double zigzag pattern seems to be the most visually pleasing thus far. The complete form of the structure exhibits corrective characteristics. The first zigzag at the Primary Degree level unfolded smoothly, reaching completion at the $1.0462 low in 2015. Previously, an Intermediate degree triangle formed as the Primary B wave, peaking at the $1.3993 high in 2014. In zigzags, C waves typically terminate near the lower channel trend lines, and in this case, the C wave fell just short of the lower Primary channel trend line. Once the currency pair rallied above the upper channel trend line, it confirmed the end of Cycle Wave-W at the 2015 low.
The Euro’s price action since the $1.04 2015 low indicates a complex corrective pattern within the Elliott Wave framework. The initial rally from the 2015 low traded sideways, correcting the first Primary Degree Wave-W. It reached a high of $1.1255 in 2018 but failed to breach the Primary Channel Trend Line on this first attempt. Subsequently, price declined and then moved back up, finally breaching the trend line in July 2020.
After testing the trend line for approximately five months, the Euro pushed up to a high of $1.2349 in 2021. It then fell back down into the Primary Degree channel, breaching the $1.0462 2015 low, although stopping short of the middle channel trend line. The Euro then rallied back up above the Upper channel trend line.
Considering the breach of the Primary Degree channel, it is likely that a new pattern is forming, indicative of a corrective structure. The overall structure traded sideways, taking the form of an expanding flat. It is worth noting that expanding flats typically have flat A waves as this one here does.
In this case, the move from the 2015 low to the 2018 high followed the pattern of an expanding flat A wave. Subsequently, the pair dropped in three waves to a low of $0.9535 in 2022, retracing a little more than the 138.2% BvsA expading flat ratio This suggests that a primary degree B wave of a larger flat is likely forming.
Once the pair rallied back up above the 2015 low of $1.04, it confirmed the formation of this larger expanding flat at Cycle degree.
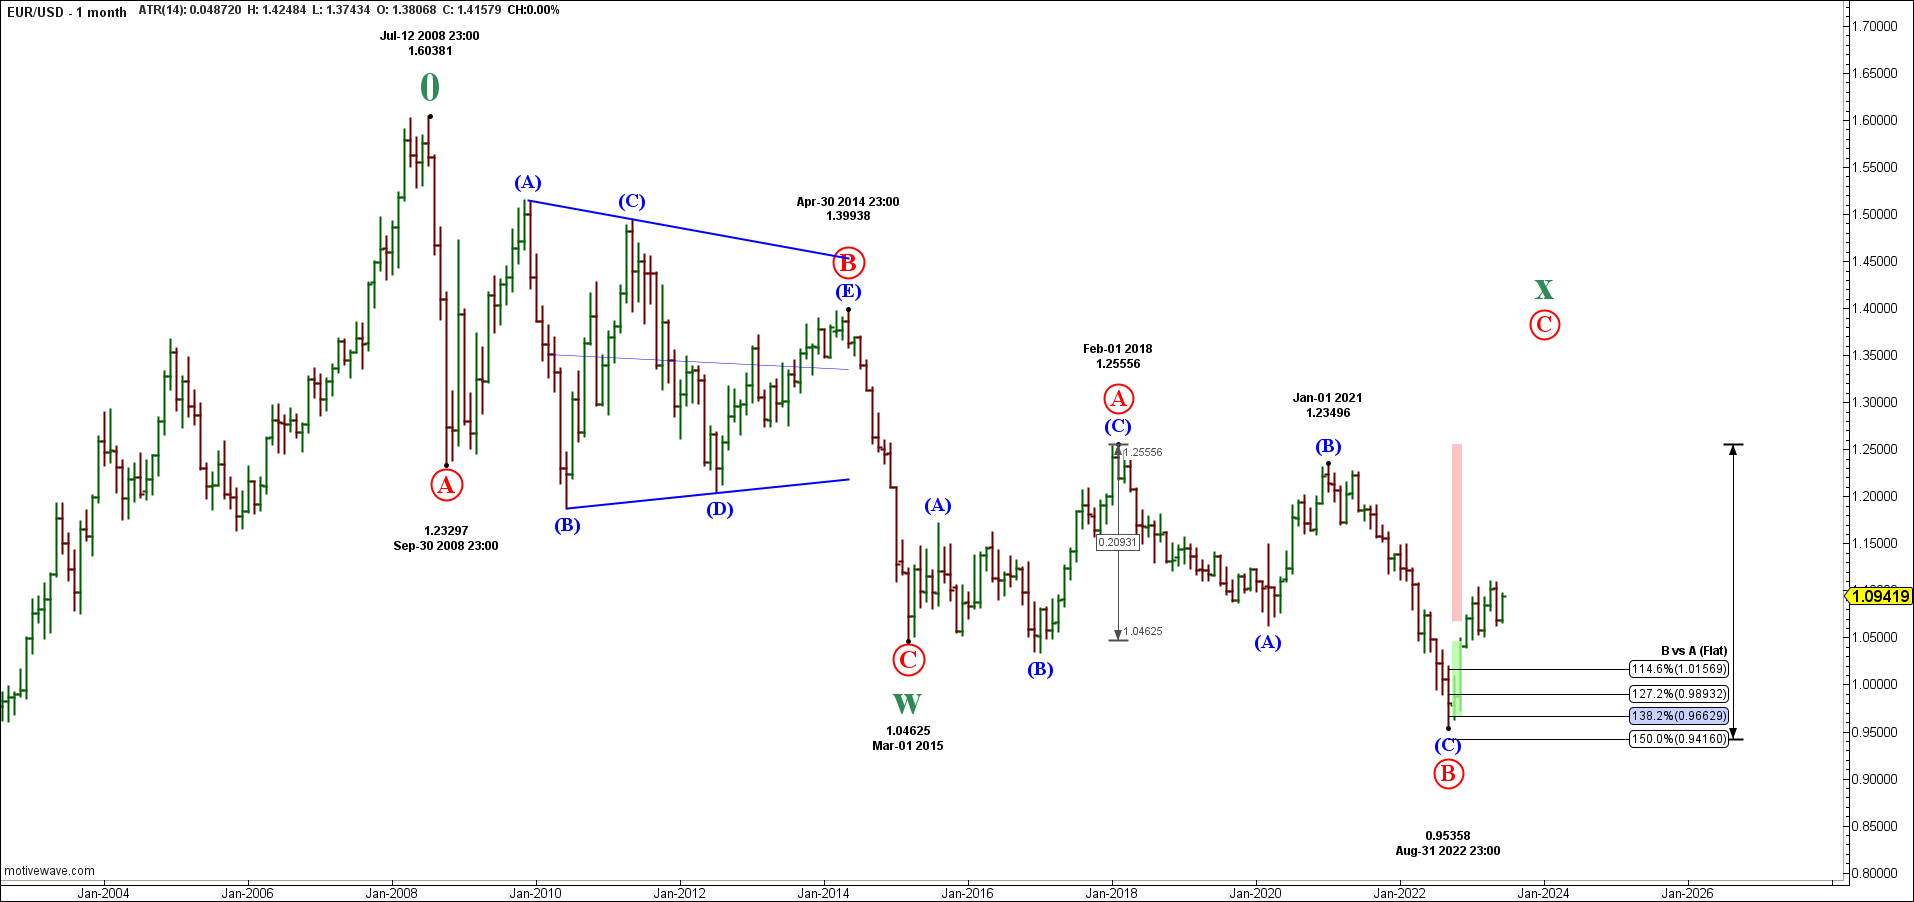
The current channel being used does not conform to the traditional Elliott Wave channel for the double zigzag pattern. In order for the Elliott Wave channel to be accurate, the currency pair would need to complete Cycle Degree Wave-X. However, I have drawn an alternative channel based on the highs in 2008 and 2021 using the 2008 low as a reference point. This channel has effectively contained the price action and has provided precise tests of the lows in 2010 and 2015.
The upward rally from the 0.9535 2022 low surpassed the $1.0462 2015 low, forming a clear impulse wave. The current C wave should reach significant Fibonacci resistances at 1.2555, 1.2996, 1.3377, and 1.3709. These levels correspond to the 100% to 138.2% CvsB retracements. Once this Fibonacci retracement zone is reached in 5 waves, we can expect a subsequent downward movement. This downward move is likely to extend well below the $0.9535 2022 low, carving out a three-wave zigzag pattern. Once Cycle Degree-X completes, it becomes possible to draw a bearish Elliott Wave Double Zigzag Channel.
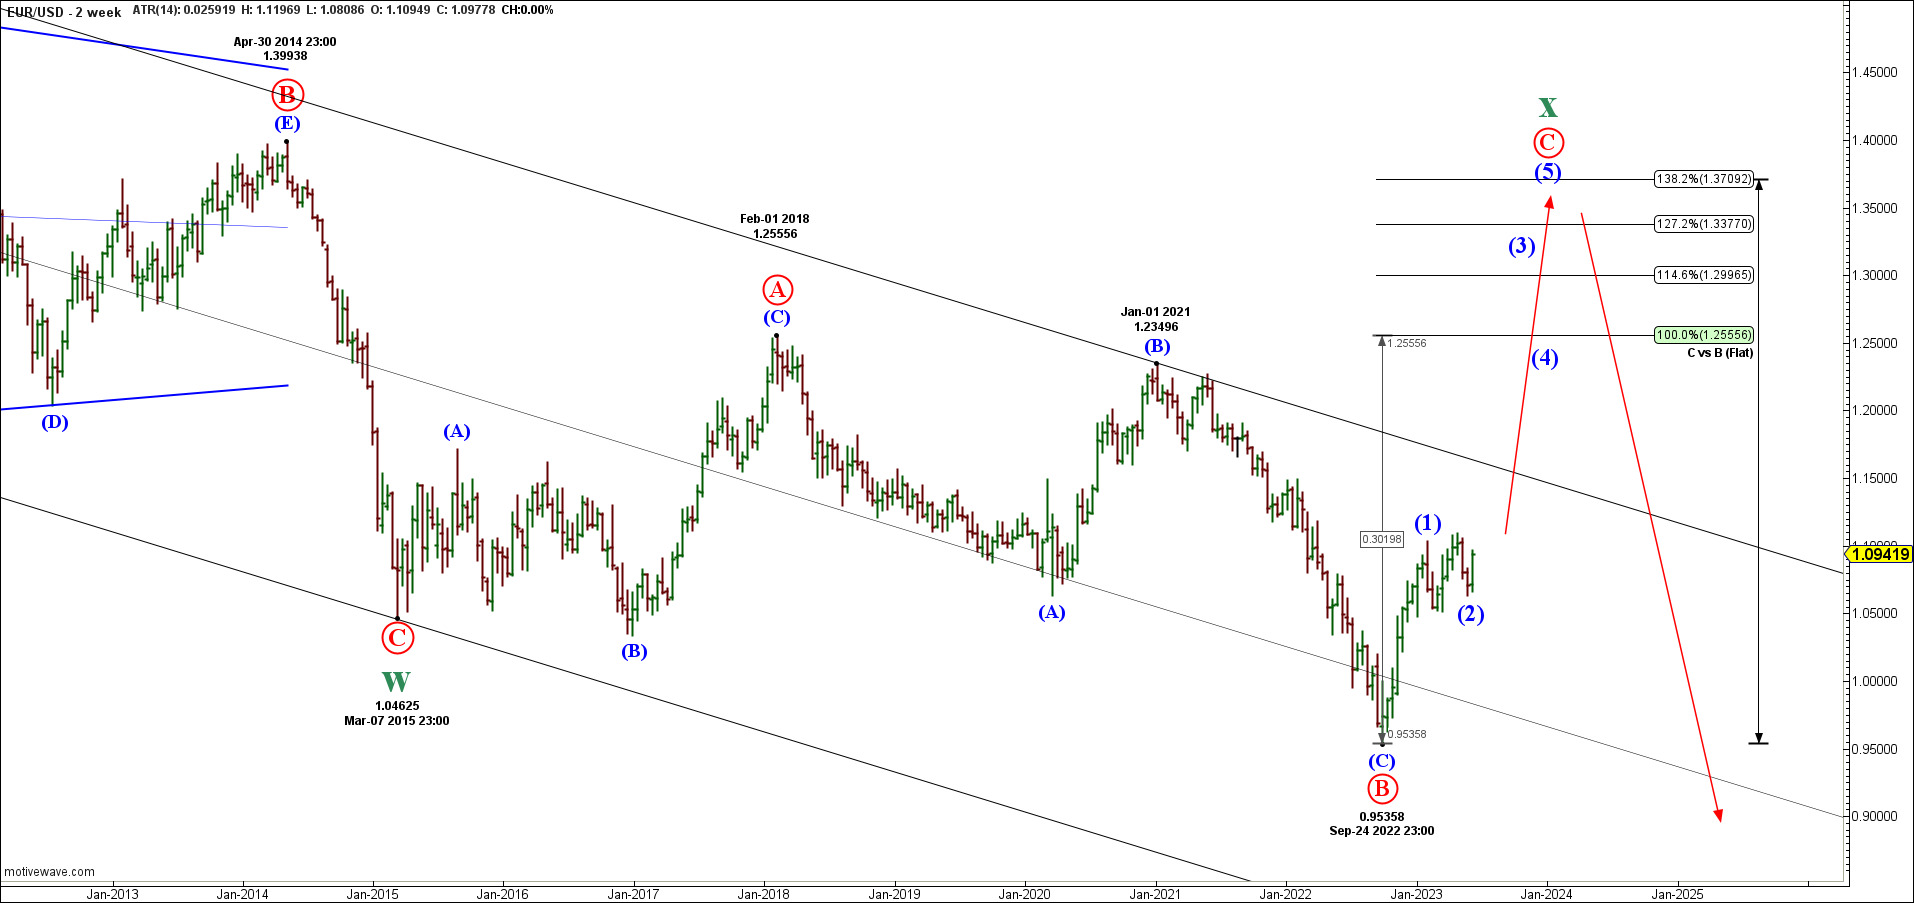
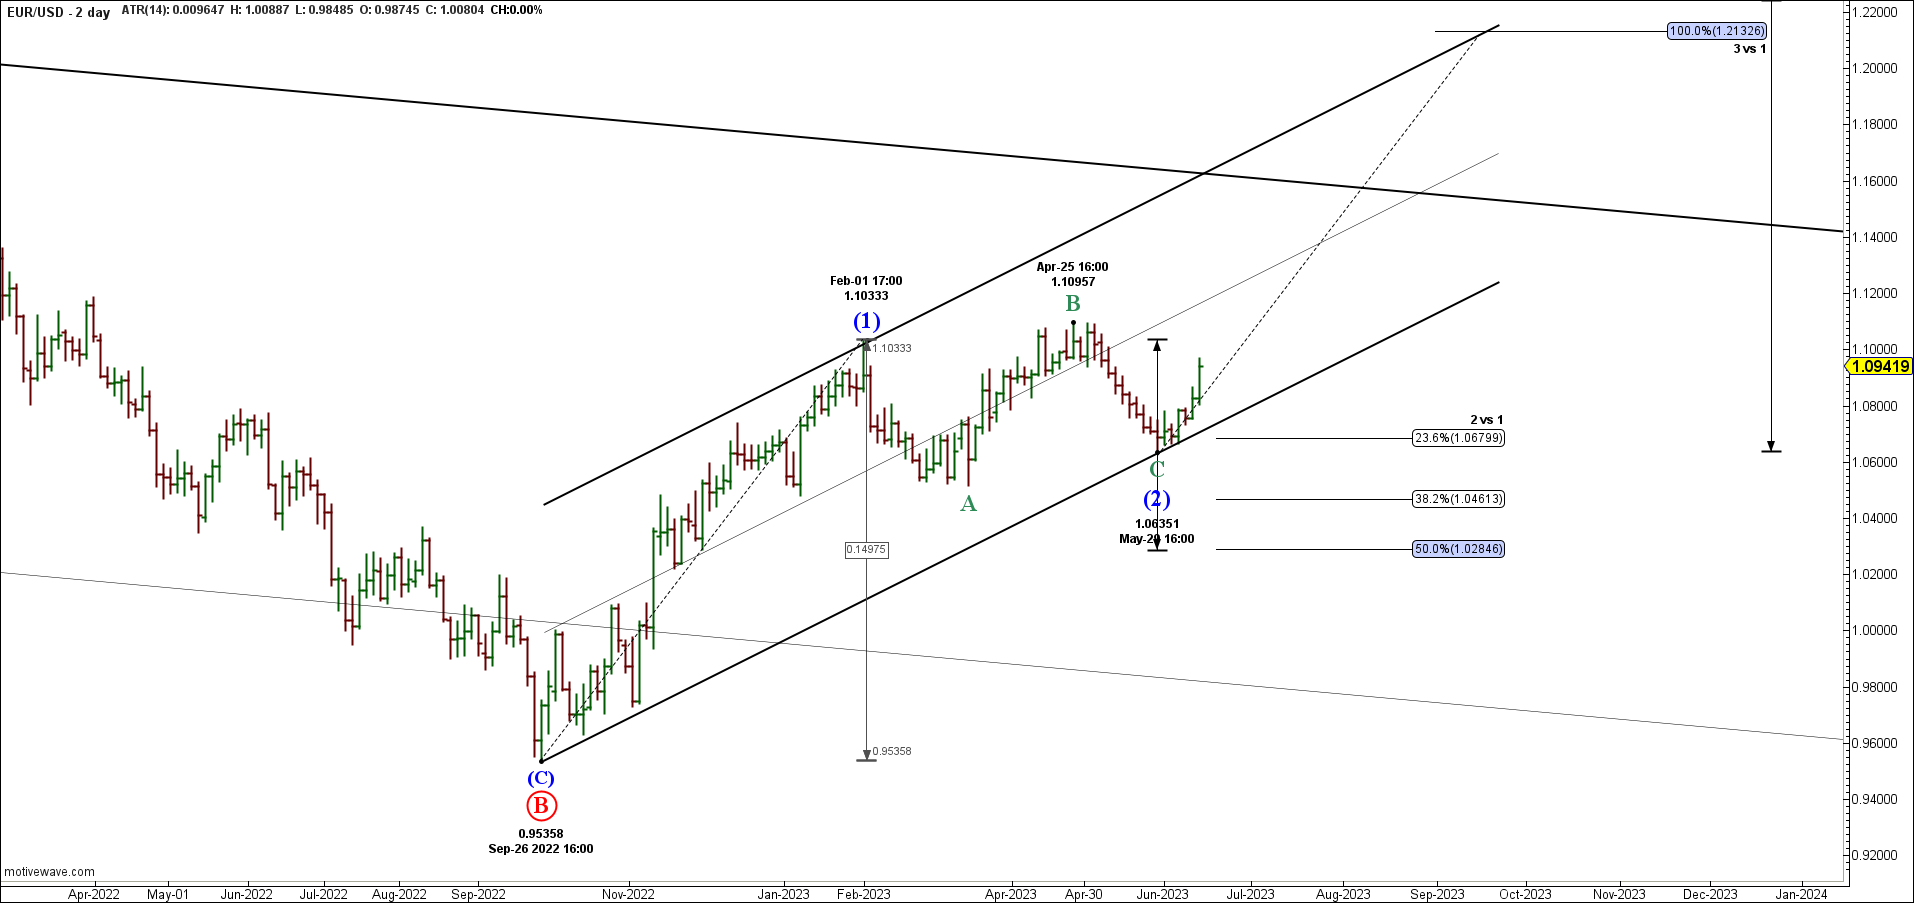
Last weeks the Euro gained better than 1.8% on the buck. This move is the fists sign that Intermediate Degree-2 is complete. Next we want to see a breach of the 1.1033 Intermediate degree-1 high. Once we get this, we can expect a move above the upper channel trend line in a wave 3 advance. Fibonacci price targets are at the 161.8% 3vs1 distance. In this case the move should get to about the 1.3058. Note that the Intermediate 127.2% 3vs1 converges with the 100% Primary CvsB making it a strong resistance level.