
USD/PEN TradingView S/. 3.8685; EUR/USD $0.9885; BITCOIN $18711
GOLD $1702; USOIL $86.36
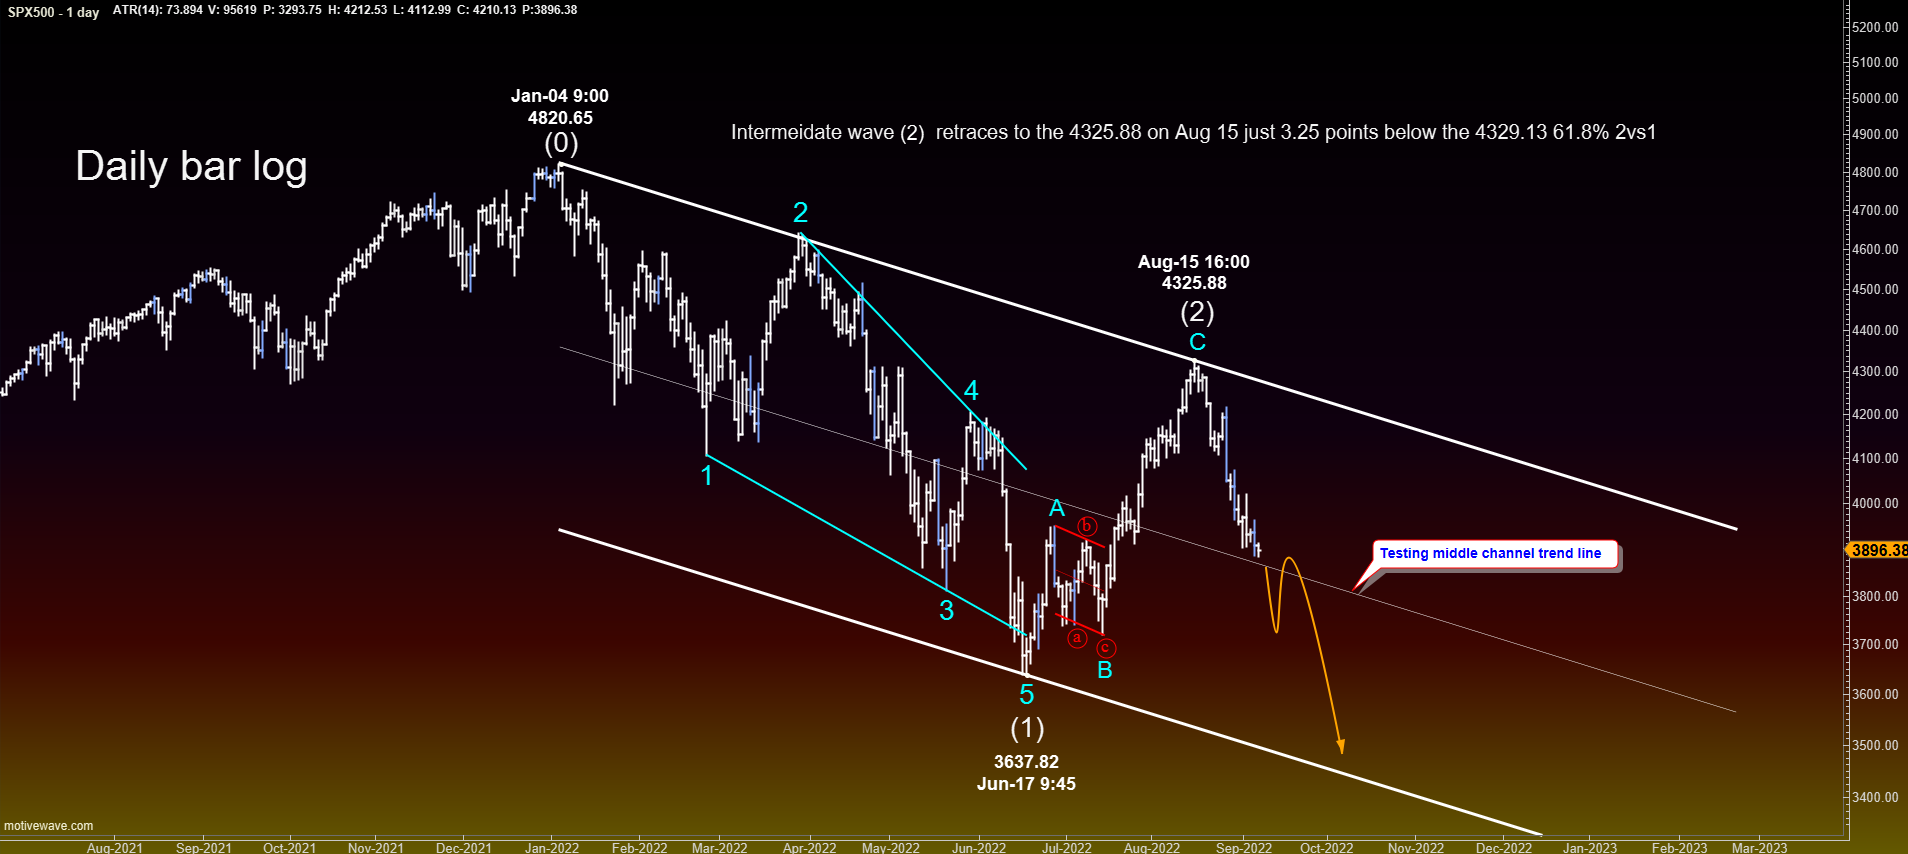
The SPX 500 is 19.44% below its 4820.65 Jan 4th all-time high. Both stocks and bonds have been sold for five days straight. The SPX 500, after retracing 61.8% of the drop it took off the all-time high, fell back on its downward trend dropping below the 38.2% and well into previous Minor Degree-B correction zone. Resistance for this zone is the 3947.70 and Support is a the 3720.85. Currently price is at the 3890.61.
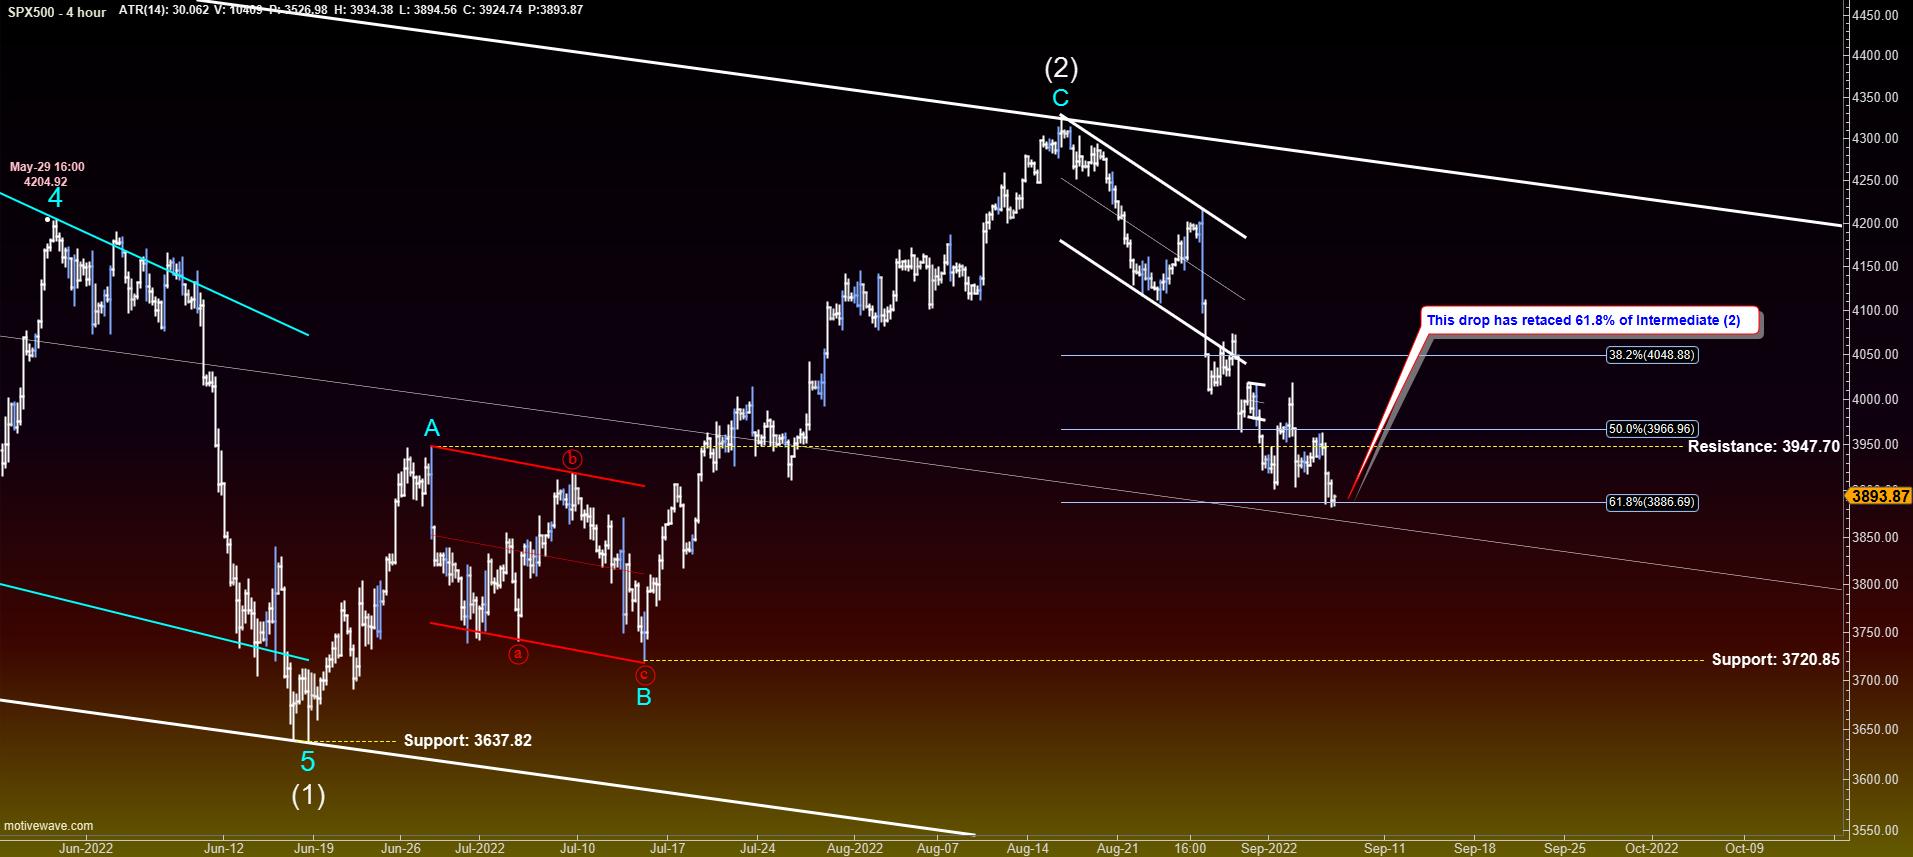
Price is already at the middle channel trend line. This channel is used to gauge whether this fall is a C or 3 wave. Downside momentum is favoring the 3rd wave. A c wave would not be a strong. ADX is ticking at 23.70 with –Di at +30 and +Di down at 16.8. Awesome Oscillator is negative at -155 and with plenty of room before oversold. Plus, the bulk of the volume average for the last 30 days has dropped down to almost 0 at 0.003. It won’t take much to push it negative. Volatility is up both short term and long term. Not a good look at all.
Momentum on the EMAs is also showing a strong bearish trend. The 144 /169 EMA tunnel is negative while a three: price, the 12, and 34s are below it. Notice how the 34s brushed up against the 144/169 tunnel and fell off, now negative. The 12 EMA is also now below the 34s with price below it. This is very bearish.
Please follow and like us: