Economía
SPX500 Bullish US Sentiment Improves
16 June 2023
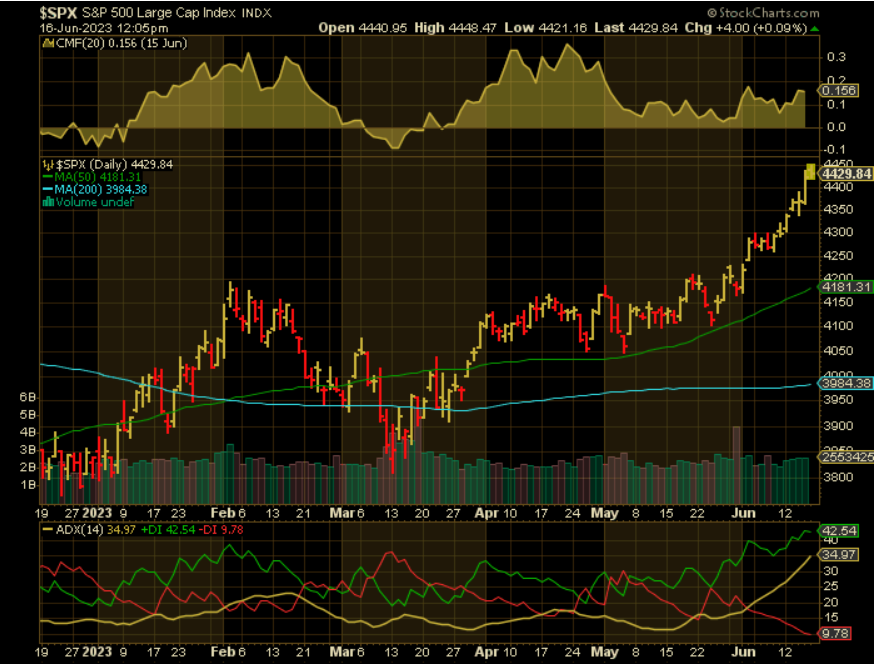
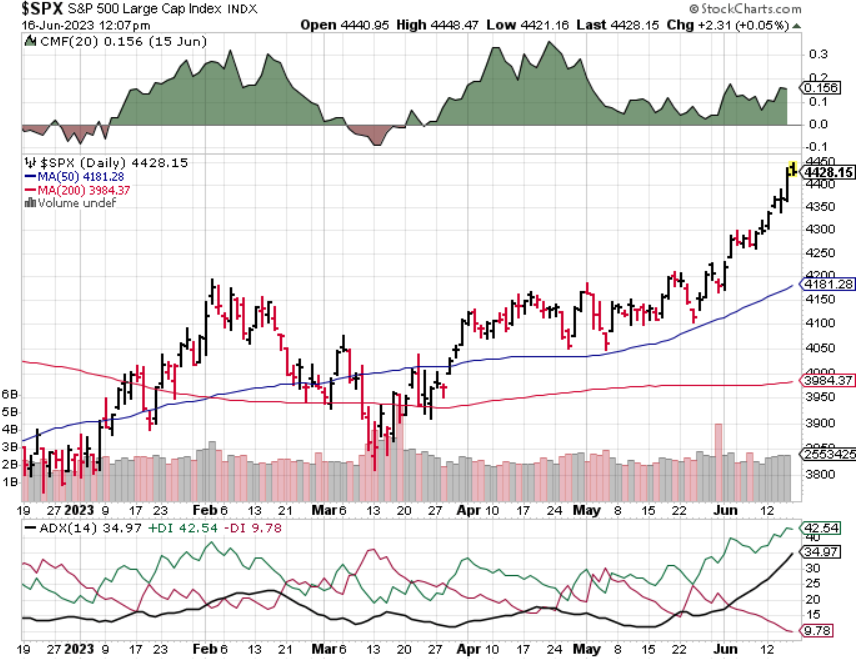
Technical indicators are bullish along the Elliott Wave structure for the SPX500 Large Caps Index CMF is at 0.156 indicating that the bulk of the volume is favoring the upside. Daily range for the SPX500 has put in a new bullish direction. Price is well above the 50 SMA and the 100. ADX is ticking storngly to the upside at 34.97! Charts by Stockcharts.com
SPX500 FXCM
June 16, 2023 9:45 A.M. Daily Bar
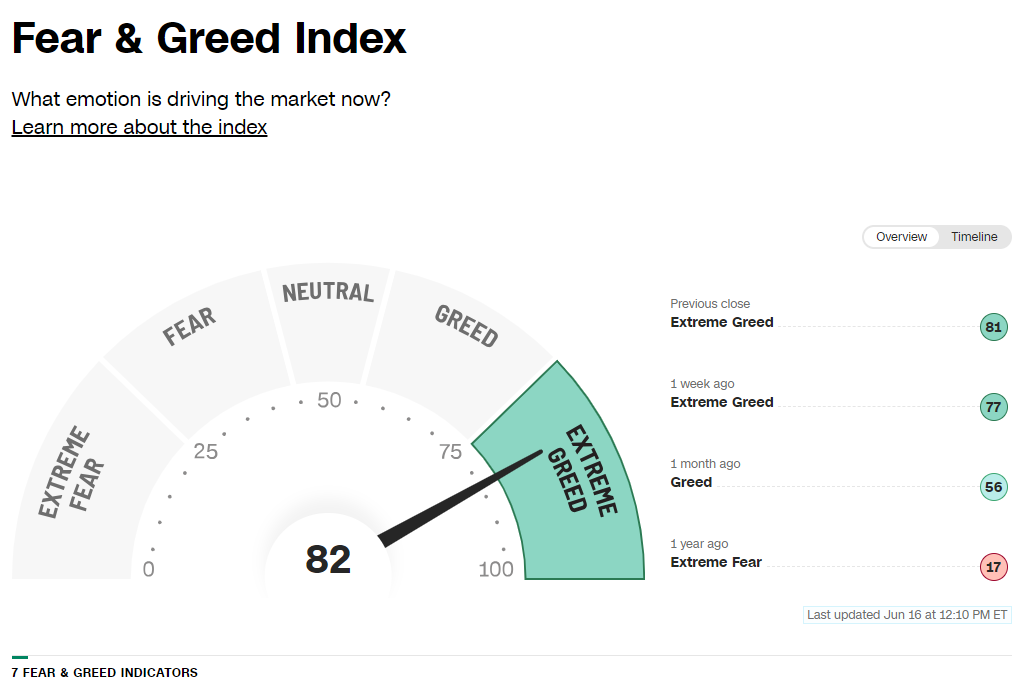
CNN Fear & Greed Index at 82 (Extreme Greed)
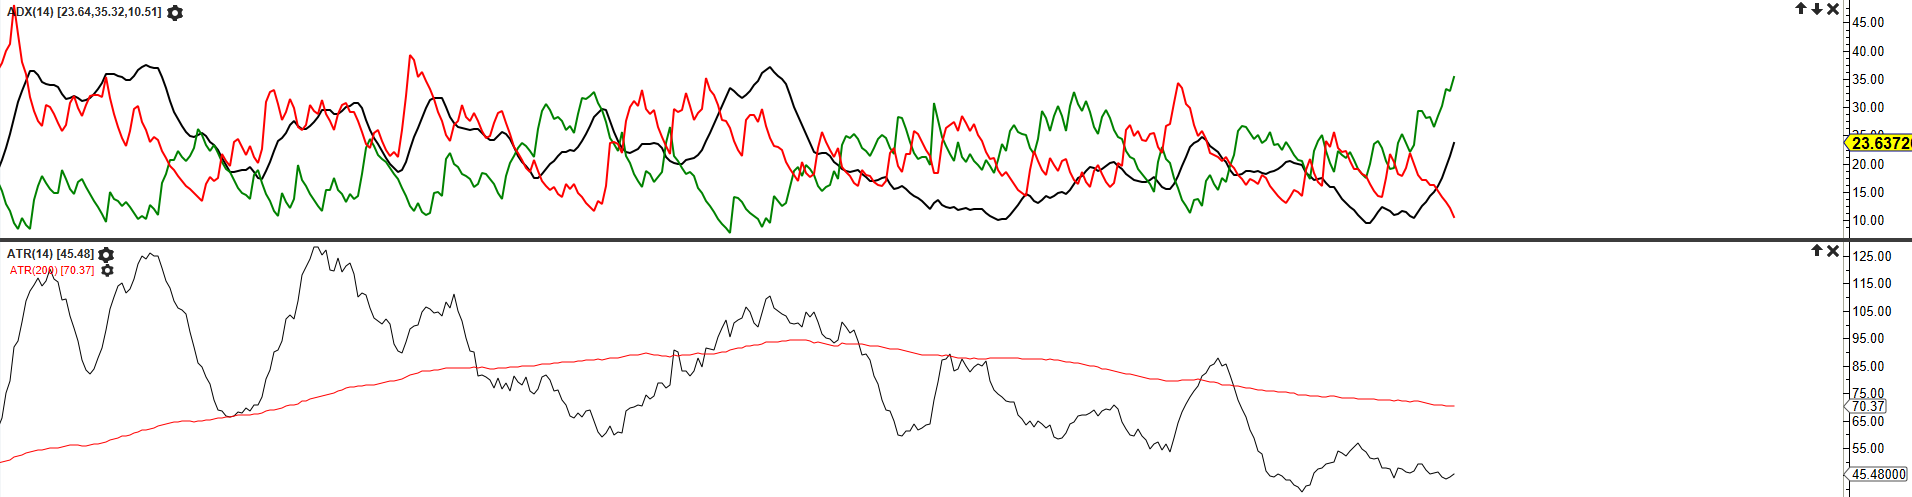
ATR (14) 45.48 (200) 70.37
ADX (14) 23.64 +Di 36.05 –Di 40.42
The low volatility on the SPX mostly favors the upside. Bullish momentum is trending nicely to the upside as the ATR is subdued down at the 45.48. The trend indicator ADX is ticking nicely at 23.64 while +Di is at 36.05. Fear Greed Index is at 82 which is at an extreme but this could stay this way until we get a Minute wave iv pull back on the recent move up from the $4105.74 May 23rd Minute ii low.
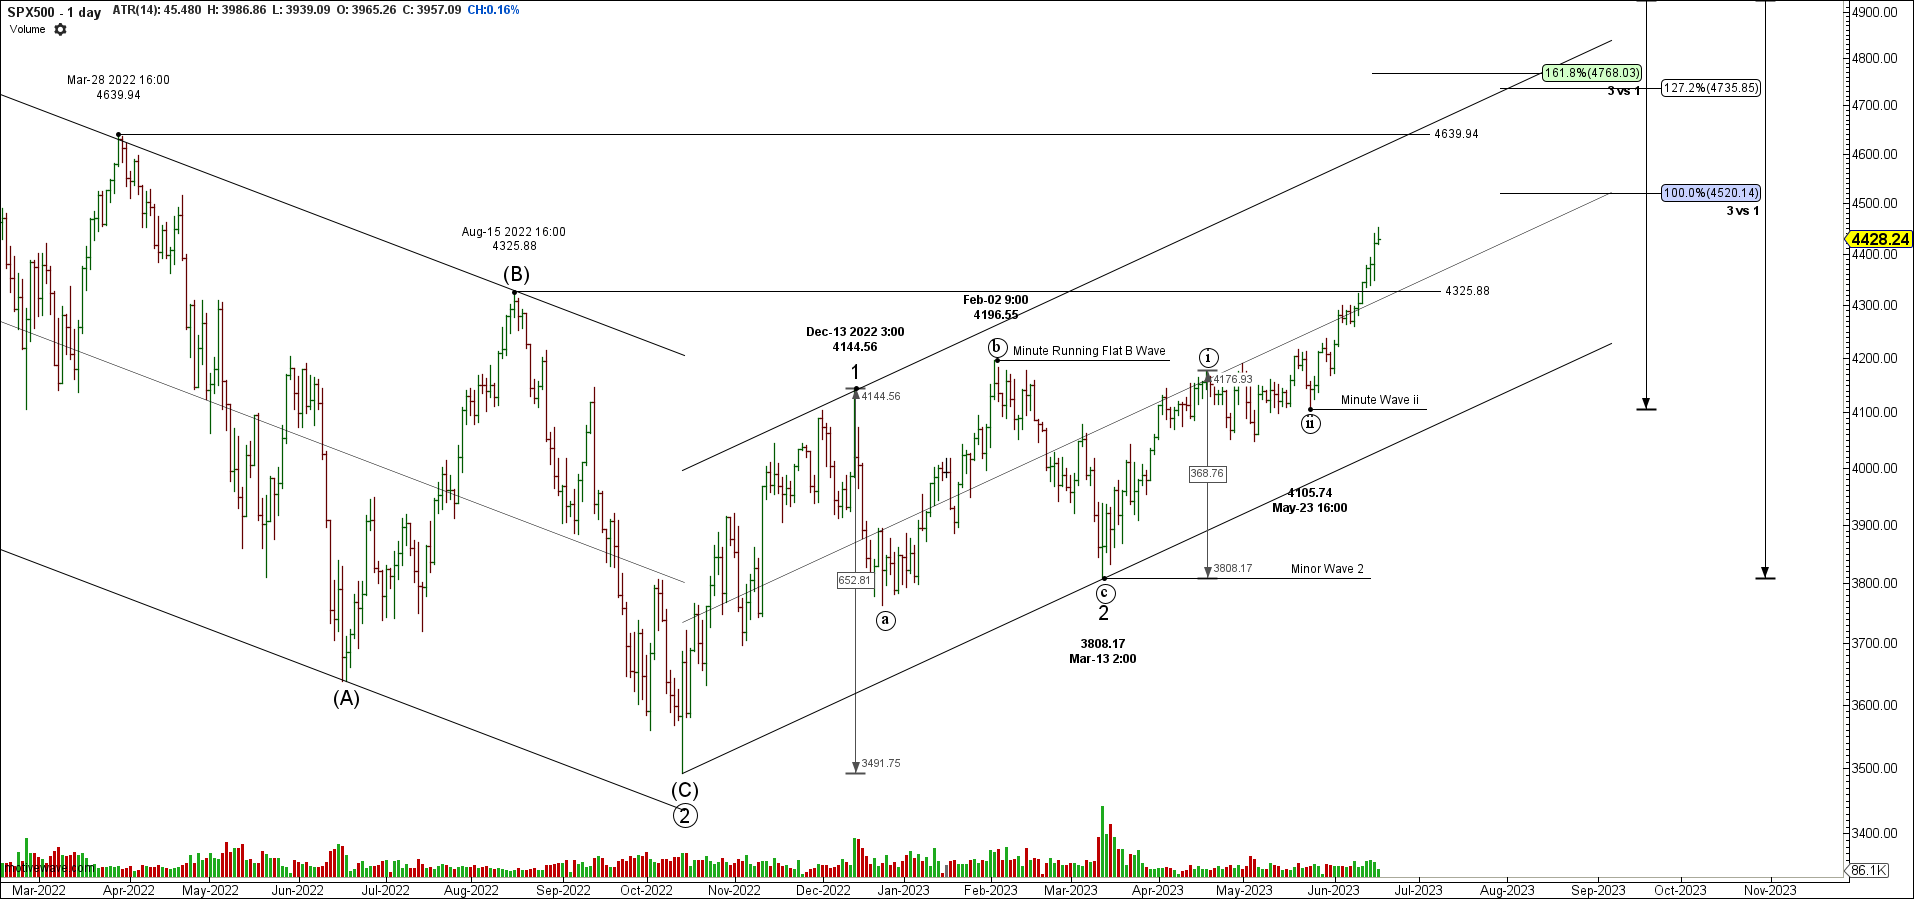
I expect minute iv to range at the $4768.03 Minute 161.8% 3vs1 along the upper channel trend line confluence with the $4735.85 Minor Degree 127.2% 3vs1.
Resistance at 4520.14 100% 3v1: 4639.94 March 28th high and upper channel trend line.
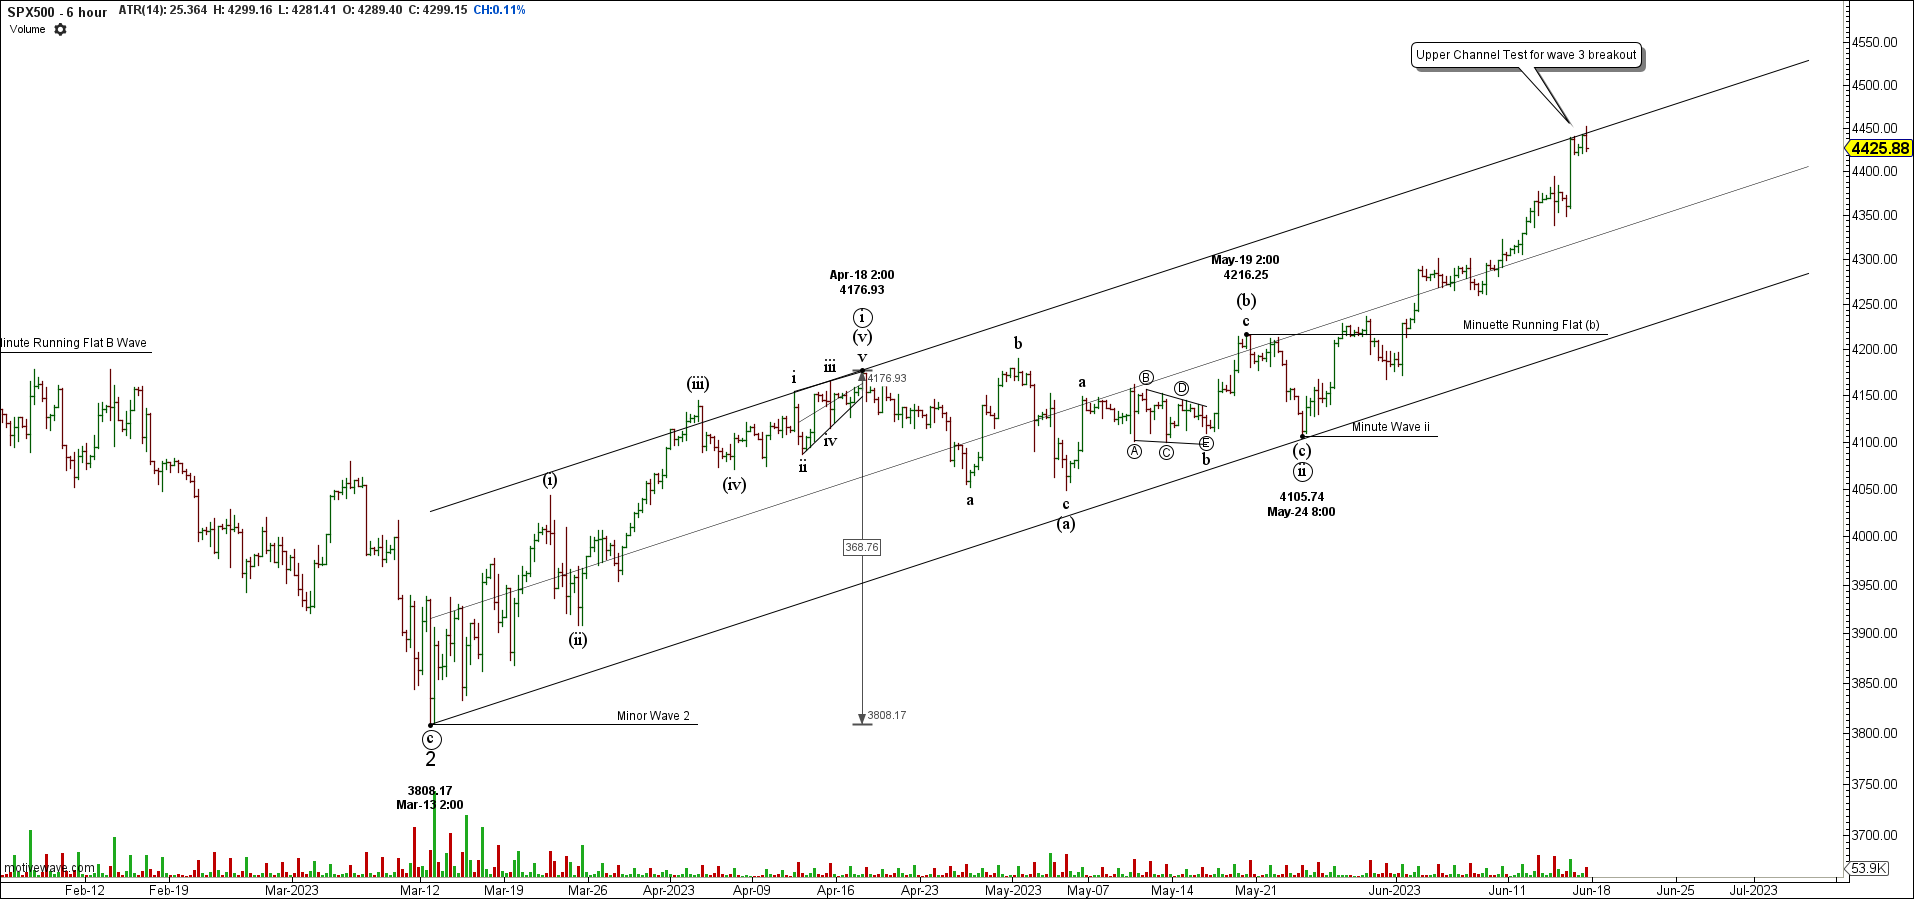
SPX500 FXCM 6 Hour Bar
The Minute impulse up from the 3808.17 March 13 low is most likely in the middle of its 3rd wave testing the upper channel trend line resistance. I expect this to push through as momentum is and the daily volatility is favoring the upside move.