Gold Elliott Wave Analysis by Raul Fernando Luna Toro
Friday gold price rallied on a safe haven bid. Long term the both the Elliott Wave structure and technical outlook are bullish for Gold’s price. However, near term a correction is very probable for the yellow metal. Fortunately, this shouldn’t last as the larger Primary fractal establishes itself talking price to a new all-time high.
Gold Price Rallies on Safe Haven
Gold rallies 1.79% on a safe haven bid as global stocks plummet. The US Dow and SPX500 lost -1.07% and -1.45% respectively. The JP225 closed down -1.67% while the Shanghai dropped -1.40%. The AU200 took a beating losing -2.28%! The blood bath sent gold’s price soring as investors ran for safety.
Daily Bar US SPX500
Gold Price Action
According to StockCharts https://stockcharts.com/h-sc/ui?s=$GOLD Gold Continuous Contract (EOD) CME rallied 1.78% as US stocks slid across the board. Friday the yellow metal opened at $1835.10 put in an intraday low of $1830.00 and intraday high of $1874.30 before closing at $1867.20.
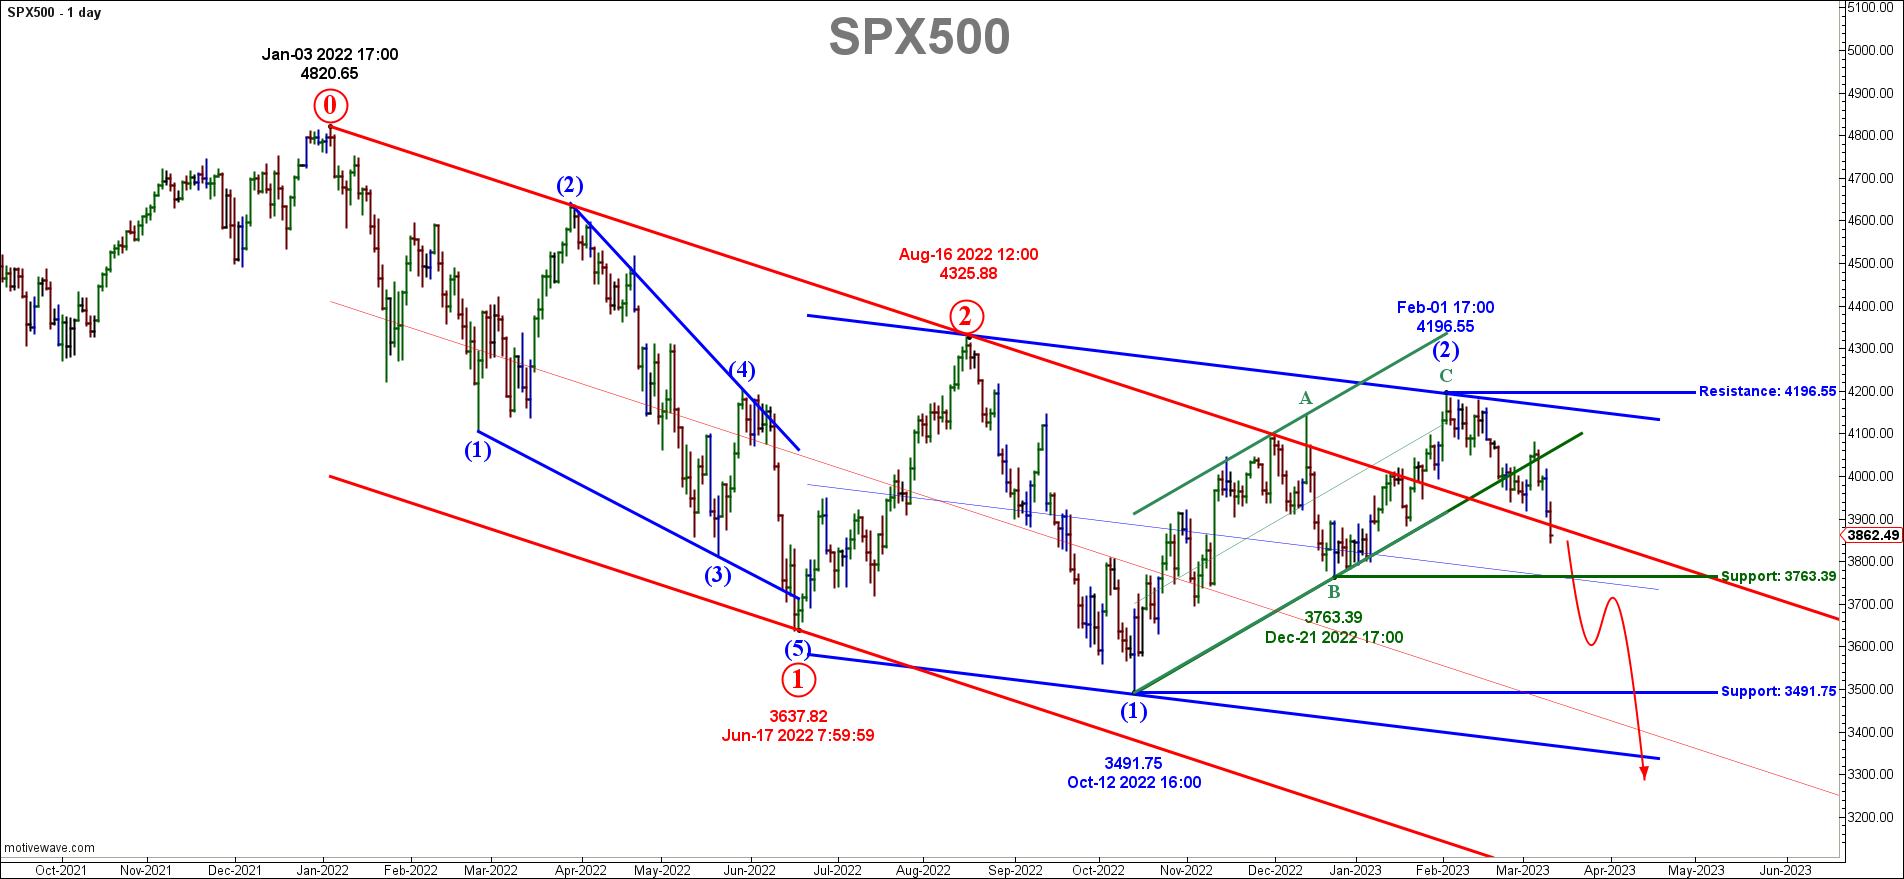
SPX500 Elliott Wave Structure
The SPX500 Elliott Wave structure is showing long term bearish tendencies. The first sign was the break down out of the Green Minor Degree channel. Then, Friday’s drop into the Red Primary Degree channel confirmed both the near and long term bearish outlook. A drop below the 3769.39 Dec 21 2022 low confirms a wave 3 decline which could take the benchmark index to the 3491.75 Oct 12 2022 low in a hurry.
Elliott Wave Technical Analysis Gold FXCM
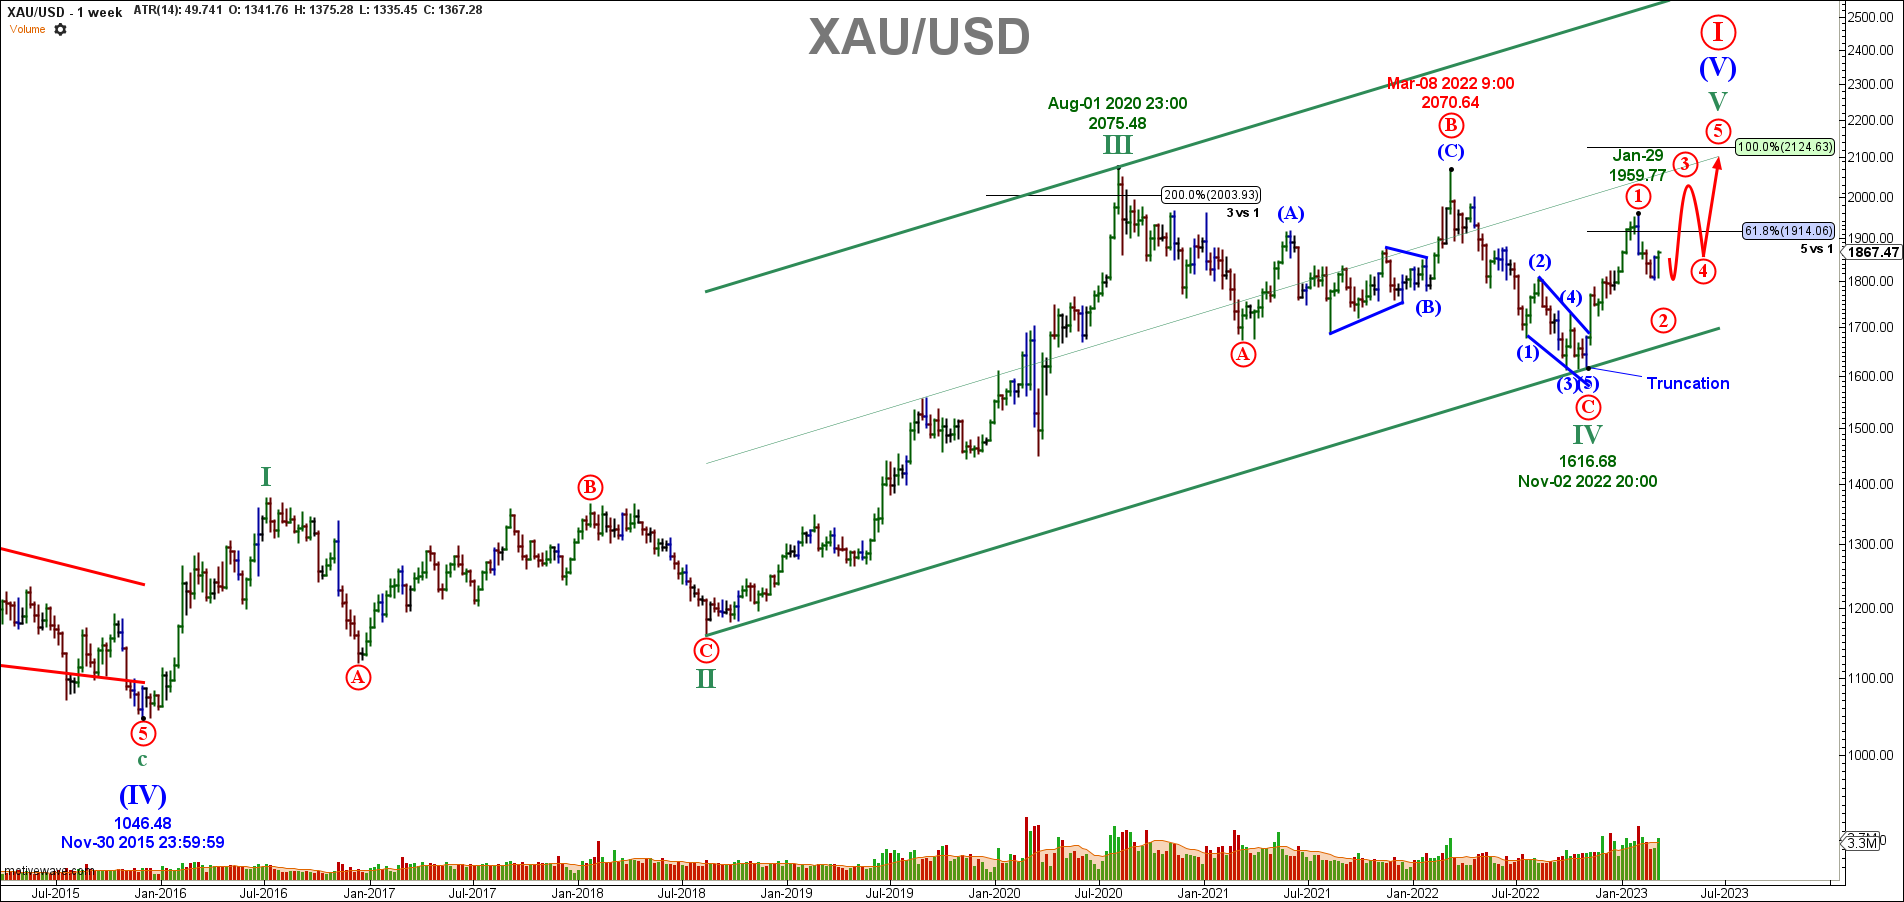
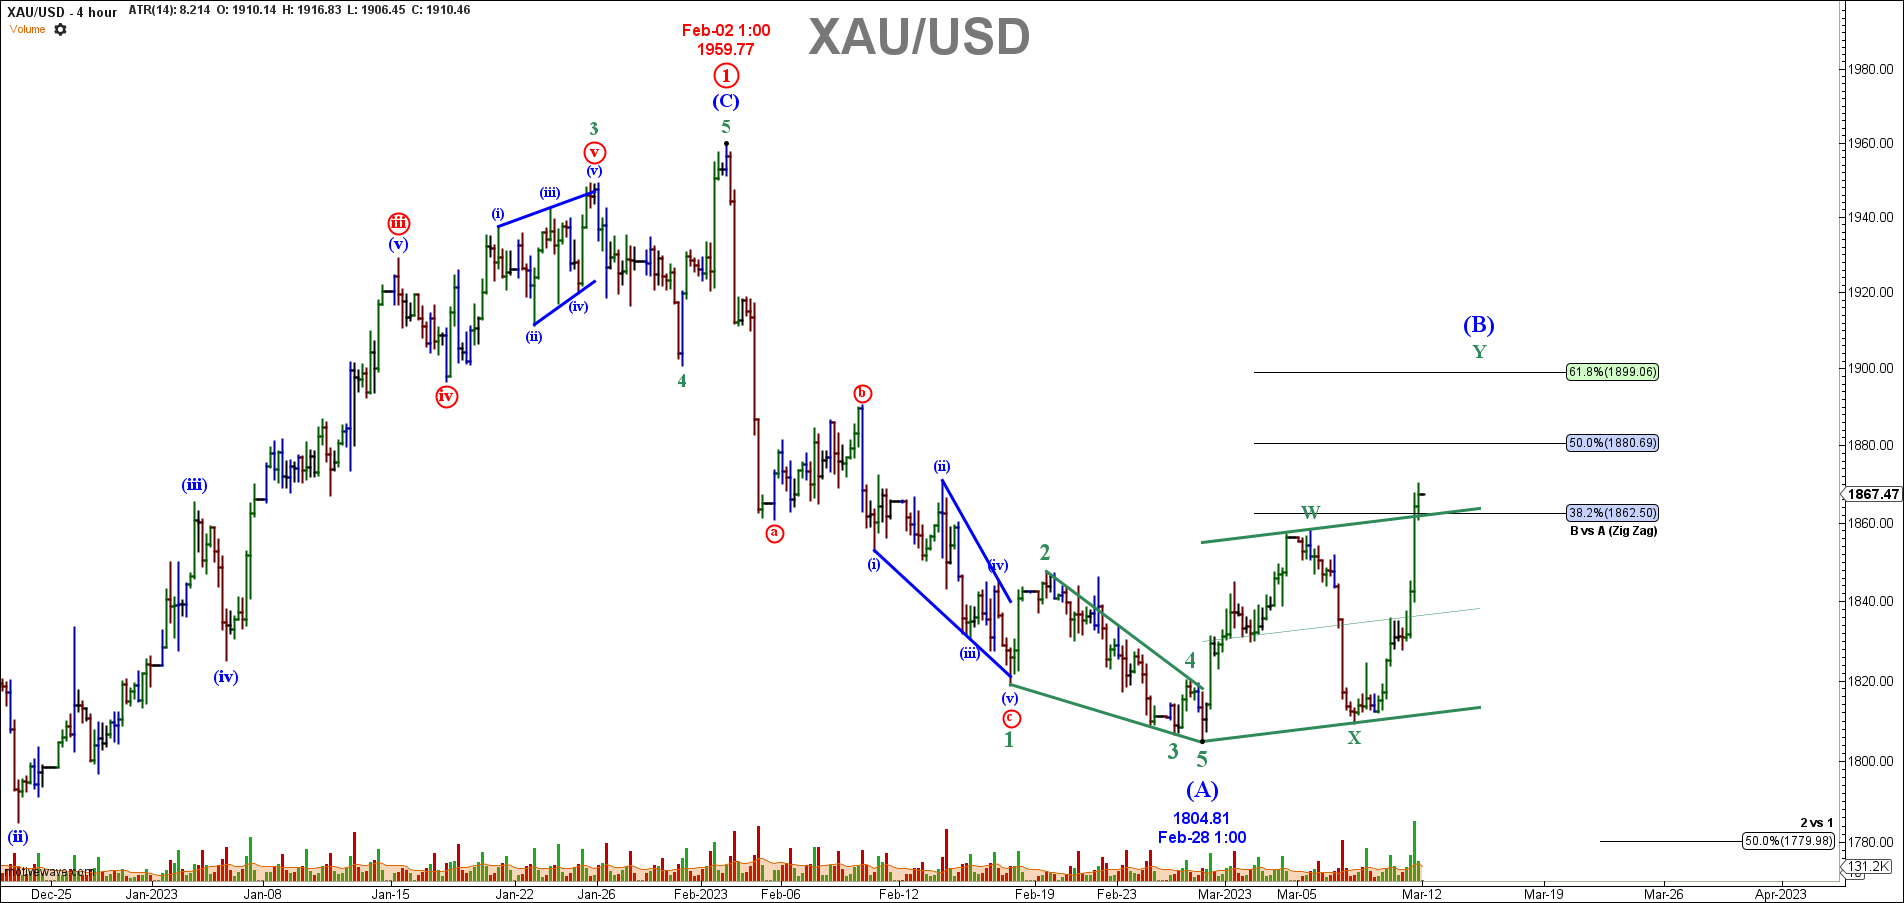
The Elliott Wave technical outlook for Gold looks good. The yellow metal has finalized Green Cycle Degree IV at the $1616.68 November 3rd low. In addition, Green Cycle Degree V is underway and should finalize at the $2124.63 100% Fibonacci 5vs1.
Green Cycle Degree V has completed its first Red Circled Primary Degree wave at the $1959.77 Feb 2nd high. Notice that this impulse capped off just past the Fibonacci 61.8% Primary Degree 5vs1. Usually, wave five carves out and ending diagonal which always forms a three wave internal for their waves 1, 3 and 5. Here, Red Circled Primary Degree 1 is sporting a Blue Intermediate Degree three wave move.
Furthermore, ending diagonal’s first waves are always the longest and Red Circled Primary Degree 1 completed past the 61.8% 5vs1. Note that if we expect Green Cycle Degree Wave V to reach its 100% 5vs1 at the $2124.63, then Red Primary Degree having past the 61.8% should be the longest wave of a five ending diagonal series.
Gold Price Sentiment and Wave Structure
MiTrade Gold sentiment index at https://www.mitrade.com/financial-tools/XAUUSD is at 23% bullish and 77% bearish. As with all sentiment indices, I use it as a contrarian indicator at very extreme levels. 77% bearish is extreme but not turn around extreme. Therefore, I expect this indicator to improve bullish a bit before it turns and registers very extreme reading as price reaches Blue Intermediate Degree (C) wave low.
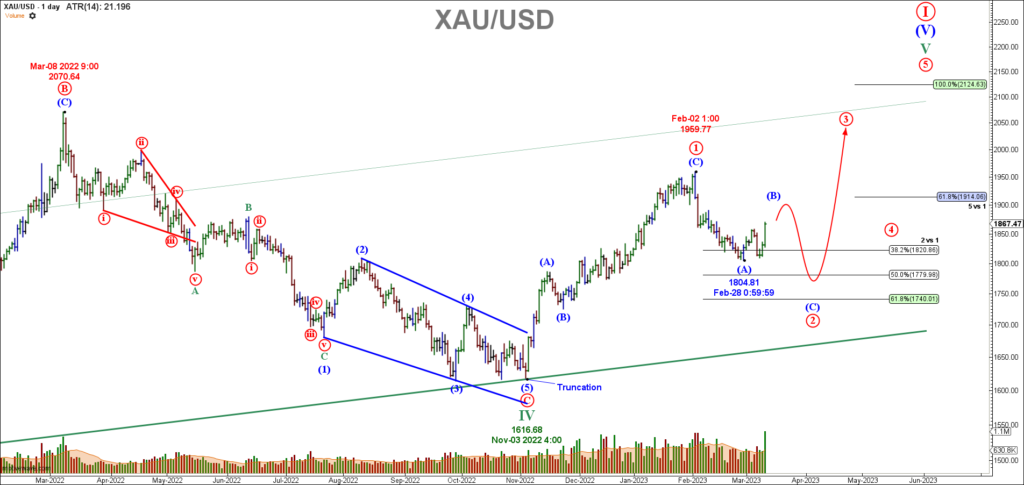
From the daily chart Below, Blue Intermediate Degree (A) has retraced down to the Fibonacci 38.2% 2vs1 at Red Primary Degree. The subsequent bounce should be Intermediate Degree (B). However, once this correction completes, Intermediate Degree (C) should drop down to Red Primary 61.8% support at the $1740.01
Daily bar Gold/USD
4-hour bar Gold/USD
Please follow and like us: